Analyze direct light pollution
The number of visible light sources and the "quantity" of light received at various points in an area define what is known as "direct" light pollution. This can be meas-ured using a 3D simulation of the propagation of luminous flux from a set of lighting points.


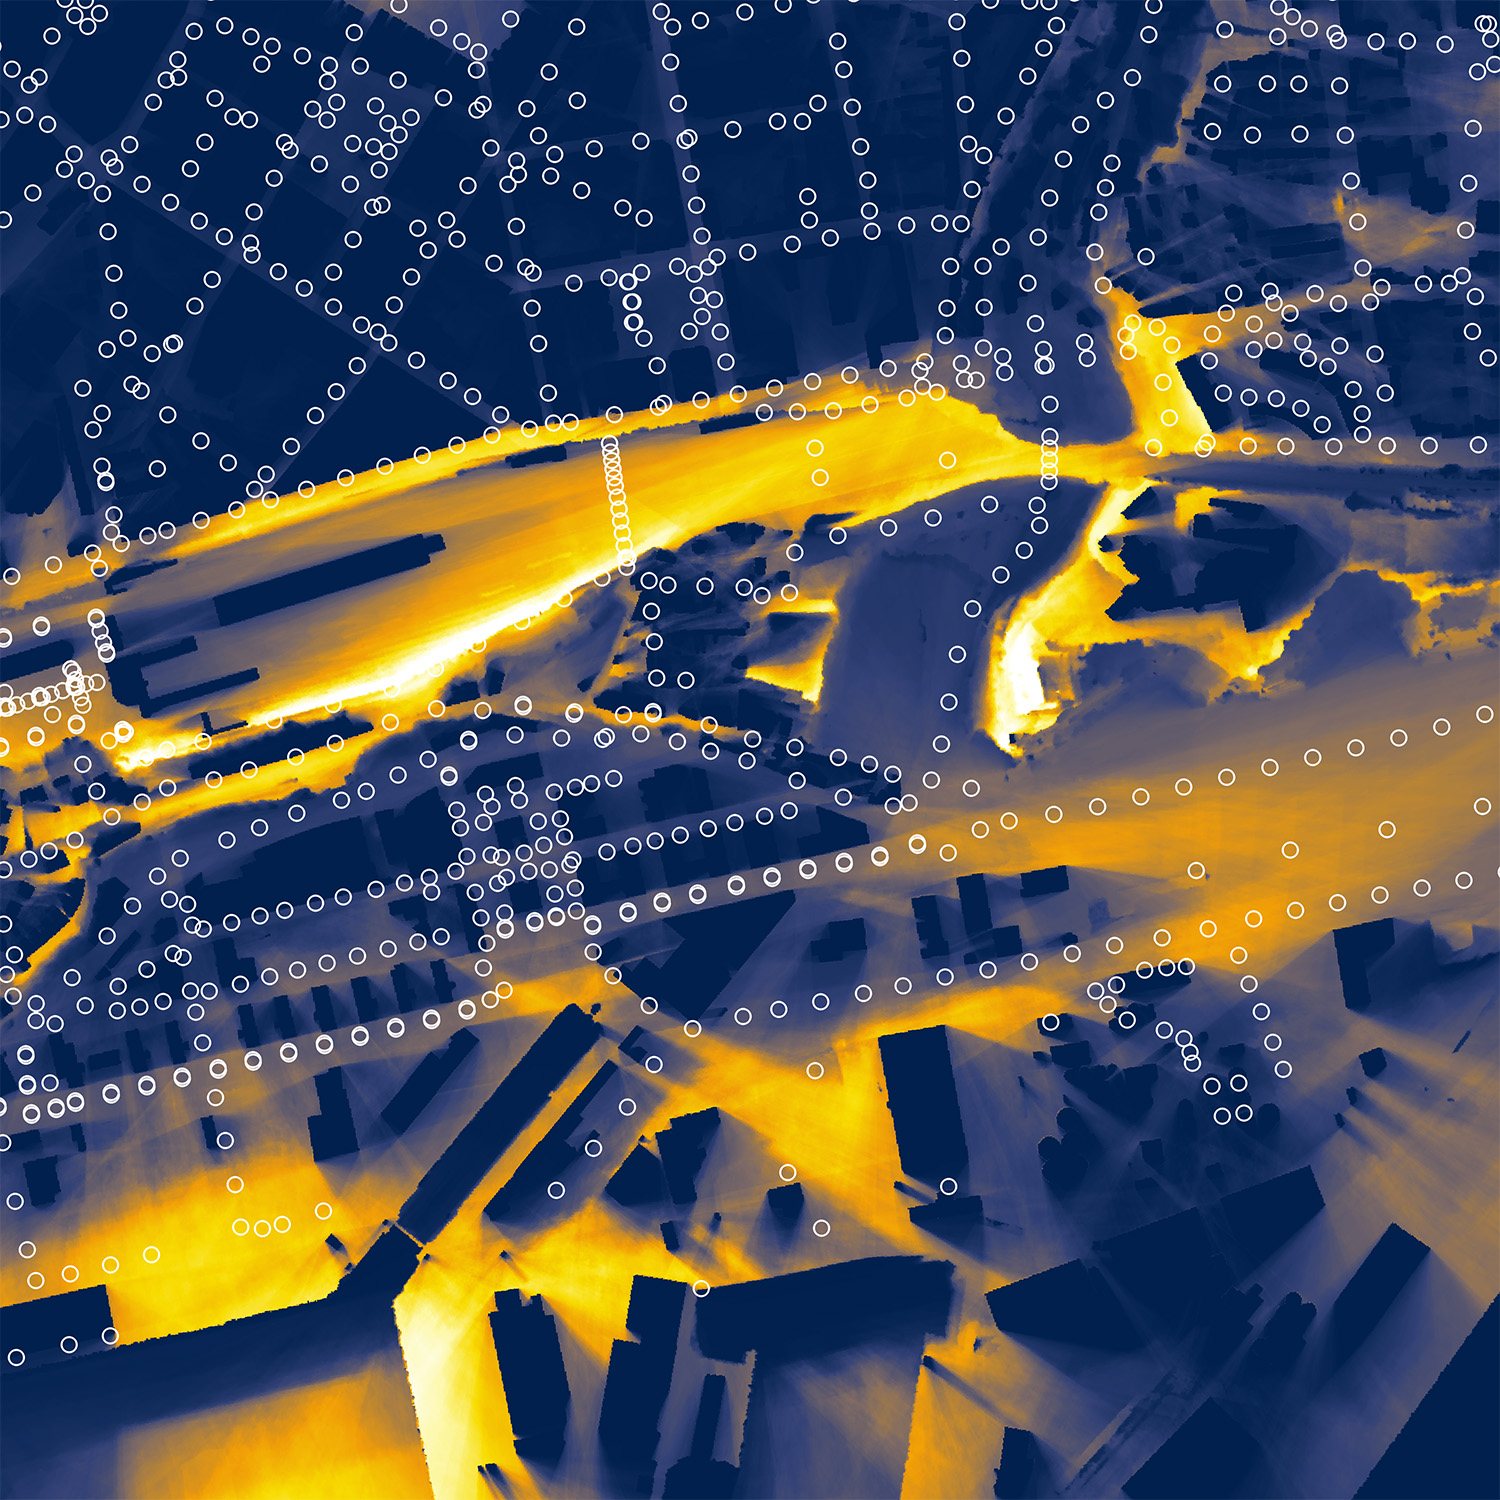
Modeling the number of visible light points
An initial analysis of direct light pollution involves mapping the number of lighting sources visible from each point in the study area, at a certain height above ground level.
This simulation is carried out by cross-referencing data relating to light points (loca-tion, height) with a 3D representation of the area (digital terrain and surface models), to take into account the light masking effect caused by relief or buildings.
The choice of height makes it possible to study various types of situation: people on the ground or on a floor, animals on the ground or flying species, etc. The choice of height makes it possible to study various types of situation: people on the ground or on a floor, animal evolution on the ground or flying species, etc.
What data do we work with?
What tools have we developed?


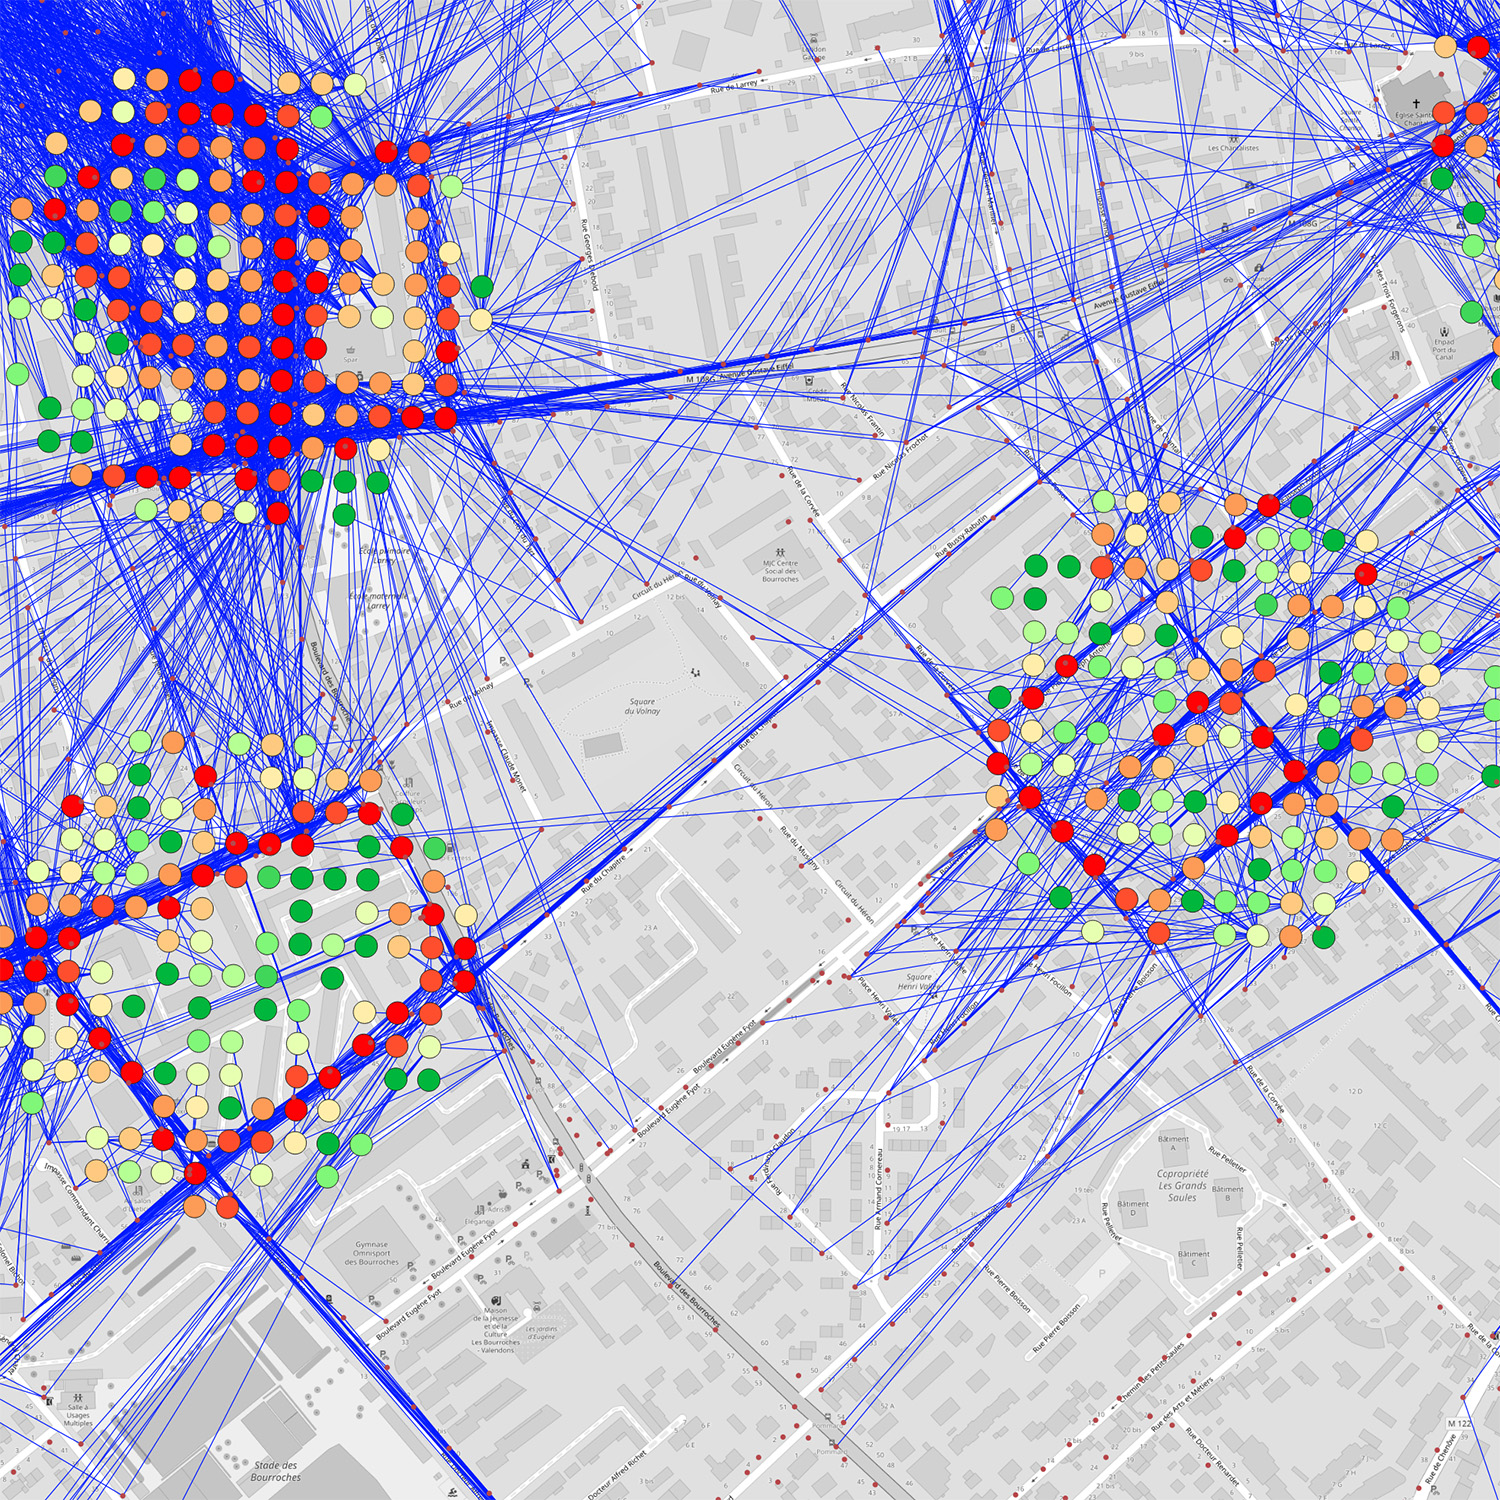
Modeling light levels
The illuminance level at a given point corresponds to the sum of luminous fluxes emitted by all lighting sources visible from that point.
This second level of analysis of direct light pollution therefore aims to map the "quantity" of light received at various points in a study area, at a certain height above ground level.
This is achieved by cross-referencing detailed data on lighting sources (power, flux orientation, height, etc.) with digital terrain and surface models.
What data do we work with?
What tools have we developed?

Our solutions in action
Would you like to find out about concrete examples of application?
We apply our tools and methods to a large number of projects every year.


