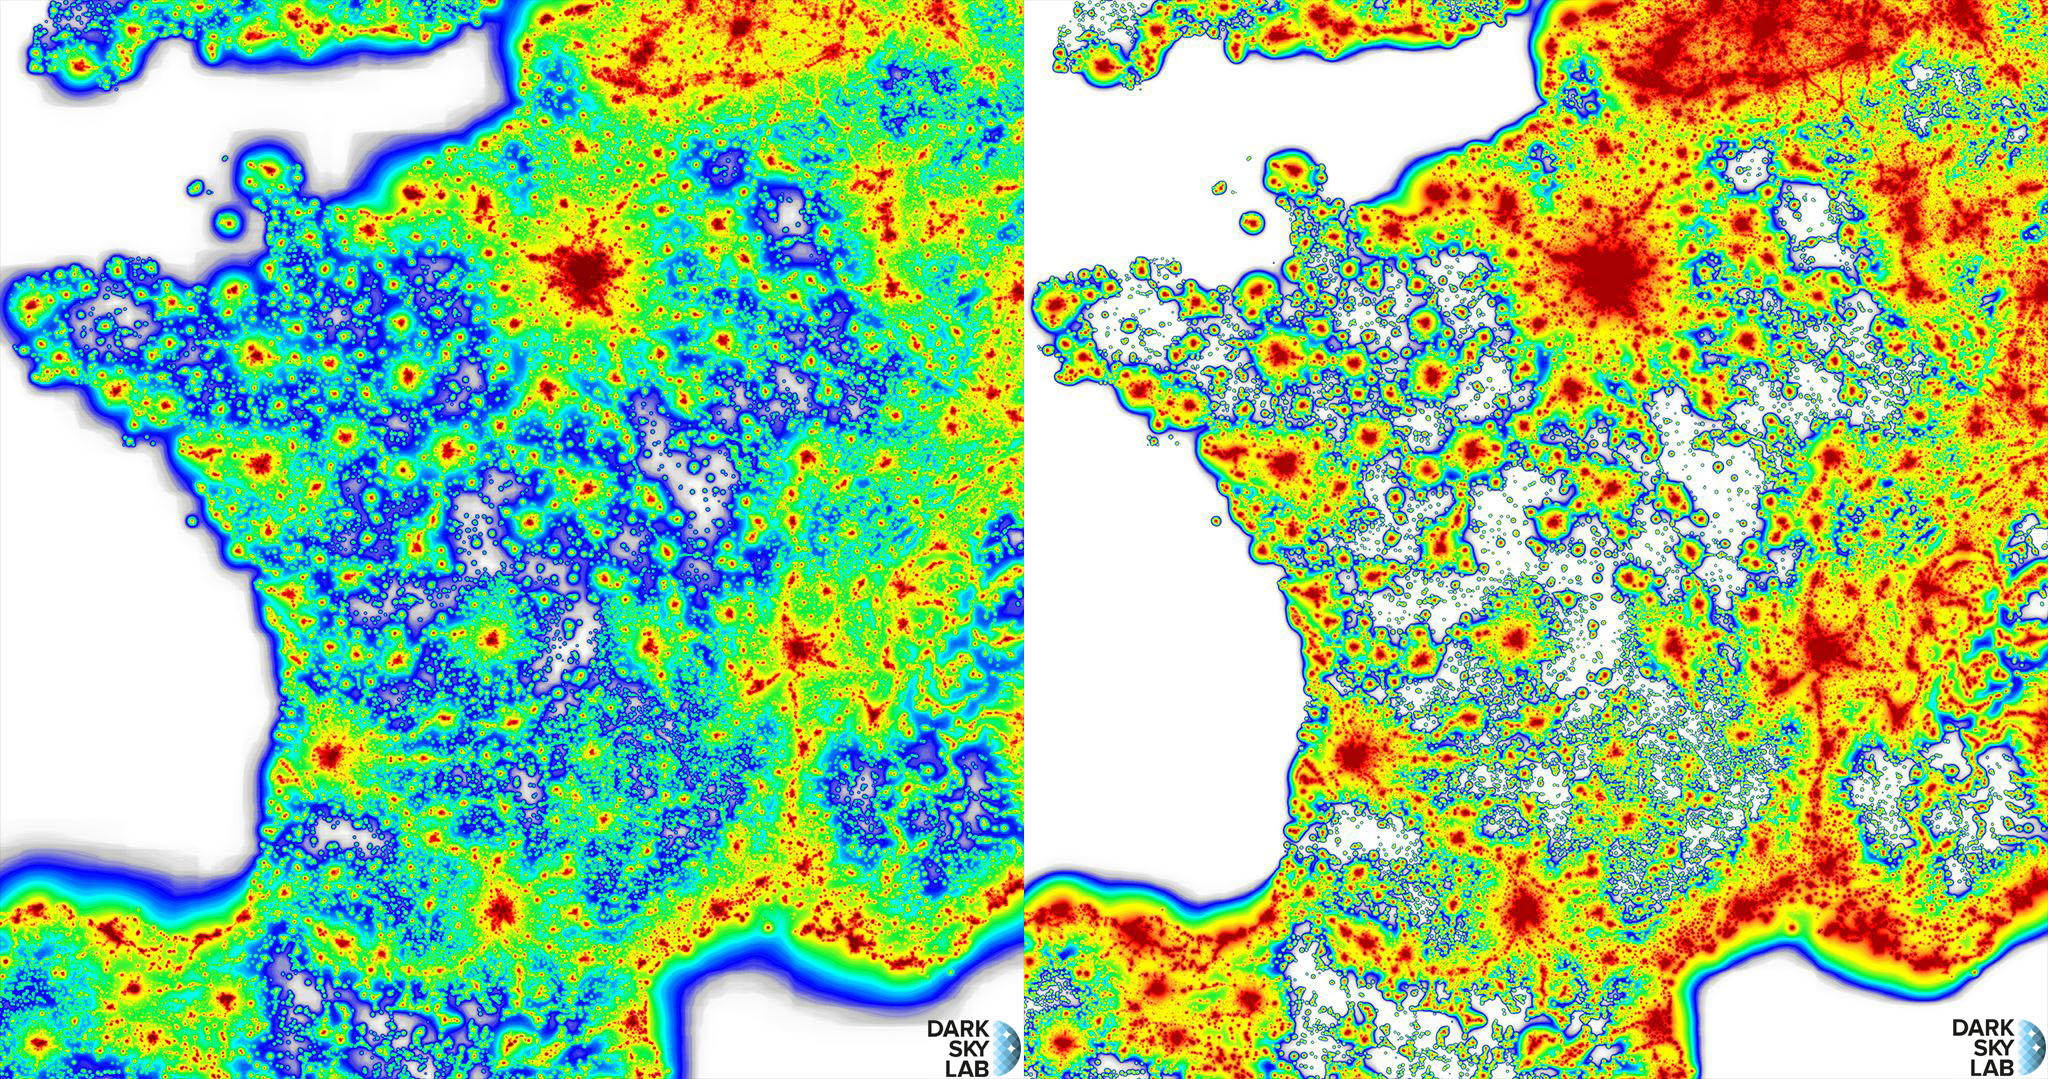
Light pollution maps of France for clear and overcast skies
August 03, 2018 - Philippe Deverchère

Light pollution maps of France as output from OTUS software: left, under clear skies; right, under overcast skies.
A complete simulation of mainland France was carried out with the Otus software using the simulation mode that takes as input VIIRS/DNB satellite radiance data (2015 annual composite data -- see page VIIRS/DNB on the NOAA site). This simulation was carried out under clear sky conditions and also taking into account cloud cover (overcast skies of more than 95%). Otus allows us to simulate the presence of clouds, which amplify light pollution over short distances and, on the contrary, darken the nocturnal environment on sites that are initially little polluted. In a way, this increases the contrast of the light pollution map, as shown below (the map on the left is the result of the clear-sky simulation and the map on the right is the result of the overcast-sky simulation).
In the map simulated with clear skies, the darker areas (in gray) are easily identified. There is a very good match between the sky brightness levels shown on this map (according to the Otus color scale presented in a previous article) and the levels provided on the 2015 light pollution maps from https://www.lightpollutionmap.info. This good match validates the approach used in the Otus software to propagate radiance sources from VIIRS/DNB satellite images.
In the simulated map with an overcast sky, we can see that some areas are very heavily impacted on large scales (Paris region, the entire Mediterranean coast, the Lyon region and the Rhône valley, etc.). As expected, the areas initially least impacted in the clear-sky map expand until they meet relatively polluted areas. We can also observe a "sprawl" of certain areas due to the presence of numerous small, scattered settlements. Some of these areas are porous, allowing continuity of nocturnal ecological corridors, while others form barriers that cannot be crossed.
