Simulation model for PNP/PNR-PA
November 30, 2016 - Philippe Deverchère
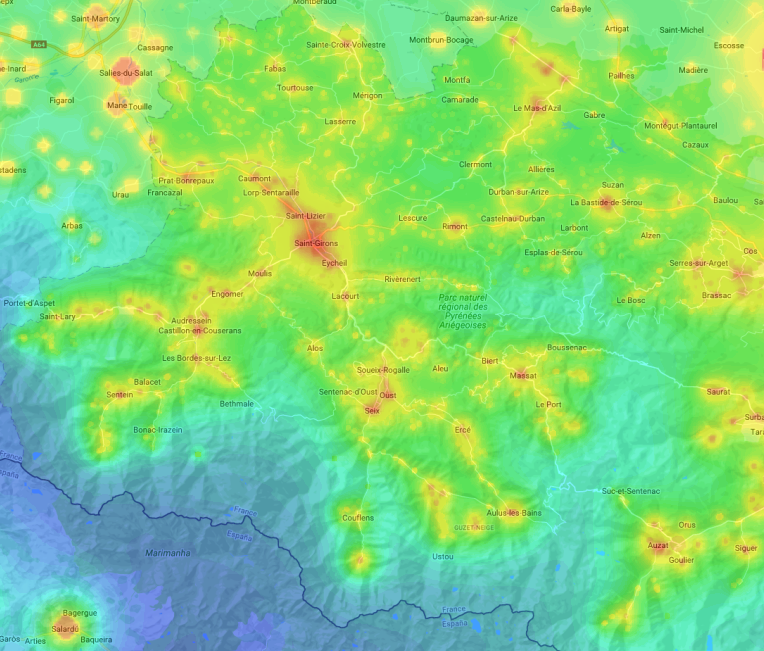
The image opposite shows the area of the Parc Naturel Régional des Pyrénées Ariégeoises mapped in GIS software. In fact, Otus automatically produces the georeferencing points for easy integration into a GIS.
The high-resolution maps produced by Otus finely show the concordance of light pollution zones with the neighborhoods of the various agglomerations present on the map.
A study has recently been carried out to produce, among other things, light pollution maps for the Parc National des Pyrénées and the Parc Naturel Régional des Pyrénées Ariégeoises. We describe here the Otus simulation model that was used in this context.
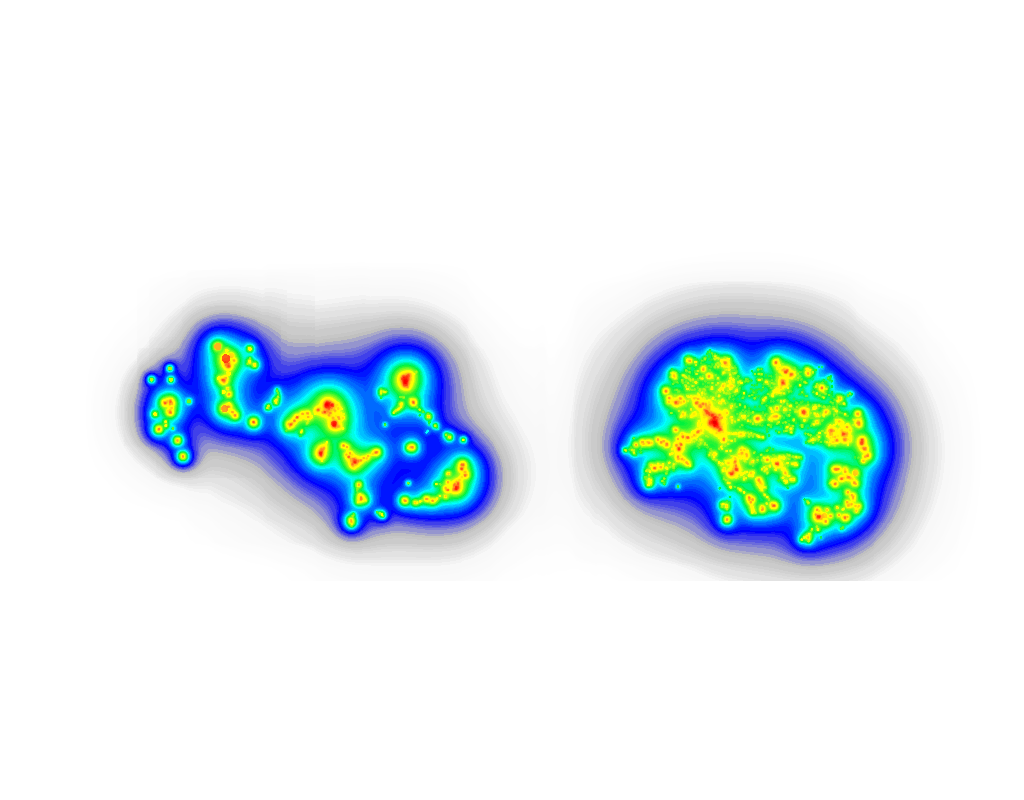
The first step is to carry out a simulation at the level of the light sources in the communes of the two parks. A 30-meter step size is used for this simulation, and the result shows the two parks with the outlines of the settlements following the distribution of public lighting. This is the study area, but it's clear that we can't simply simulate this area alone, given the influence of major cities such as Toulouse and even Barcelona.
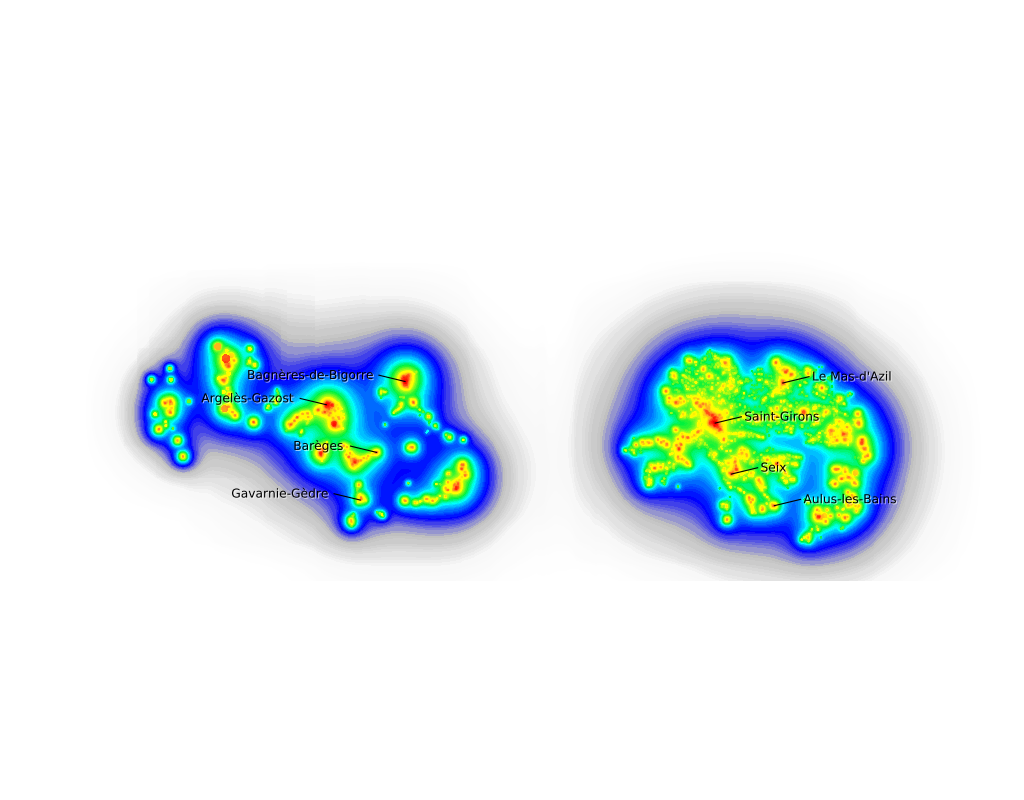
This map shows the location of a number of towns in the PNP (to the west) and in the PNR-PA (to the east).

The screenshot opposite shows the extension of the study area in latitude and longitude used to produce the maps above.
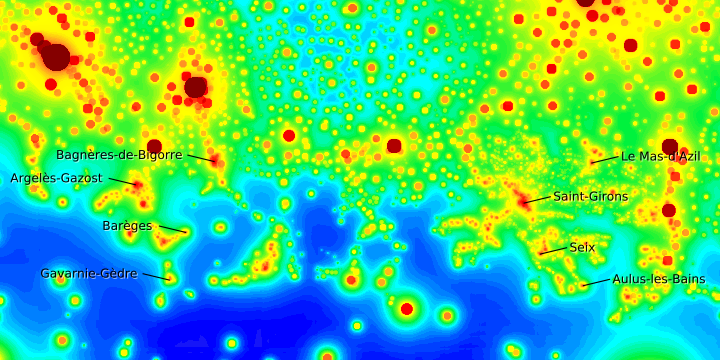
The Otus mixed simulation model allows us to simulate a study area at the level of discretized light sources with a small simulation step (here 30 meters) and to combine the result of this simulation with the effects of a much larger zone of influence, which is simulated with a larger step. This approach preserves the advantages of detailed local simulation without ignoring the influence of distant conurbations.
This map shows that all the towns outside the study area are simulated with a spherically symmetrical population-based model. This is not a problem insofar as what interests us here is the influence these towns have on the study area and not the towns themselves in terms of local light pollution levels.
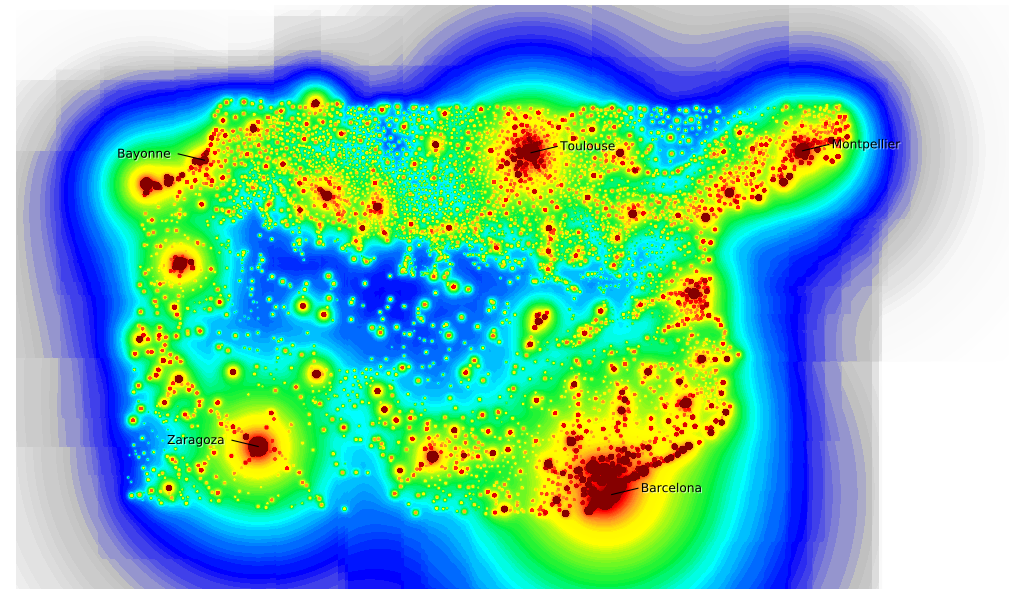
In this mixed simulation, the step size used for the zone of influence is 0.3 kilometers. The zone of influence is defined by the following geographical coordinates: 41.25° to 43.90° in latitude and -2.0 to 4.3° in longitude.
This is a very large zone, stretching from Barcelona in the south-east to Bayonne in the north-west. A global simulation of the entire zone of influence (without using discretized light point data for the study area) with a step size of 200 meters is shown opposite for illustrative purposes. It clearly shows the darkest area of the Pyrenees south of Mont Perdu in Aragon.
The simulations show that we cannot eliminate large, distant cities in the mixed simulation mode. They have an influence on the brightness of the background sky, even at distances of over 200 km.
As an example, here's a section of the Parc Naturel Régional des Pyrénées Ariégeoises: in the simulation on the left, the city of Barcelona has been included in the zone of influence (which is located 200 km as the crow flies from Saint-Girons), while in the simulation on the right, Barcelona and Spanish cities located at a latitude below 41.75° North latitude have been eliminated. We can clearly see that the darker areas are significantly modified and that darker corridors disappear if we take into account a wider zone of influence that includes Barcelona.


The image opposite shows the area of the Parc Naturel Régional des Pyrénées Ariégeoises mapped in GIS software. In fact, Otus automatically produces the georeferencing points for easy integration into a GIS.
The high-resolution maps produced by Otus finely show the concordance of the light pollution zones with the neighborhoods of the various agglomerations present on the map.
The video below shows the result of the simulation carried out on the PNP/PNR-PA and integrated into a Google Earth 3D map. Otus georeferencing makes it easy to apply a sky quality prediction map in the Google Earth environment, then move around the map.
In this video, we start by taking a dive over the town of Lourdes, then progress southwards through the Gaves valley. In this video, we can see that Lourdes, which is part of the zone of influence, is simulated with a spherically symmetrical model, while the towns to the south, which are part of the study area, are simulated with a discretized model that faithfully reproduces their contours. We then move on to the Parc Naturel Régional des Pyrénées Ariégeoises, finishing with the Pic du Midi, La Mongie and Luz-Saint-Sauveur.
