Modeling the quality of the night sky
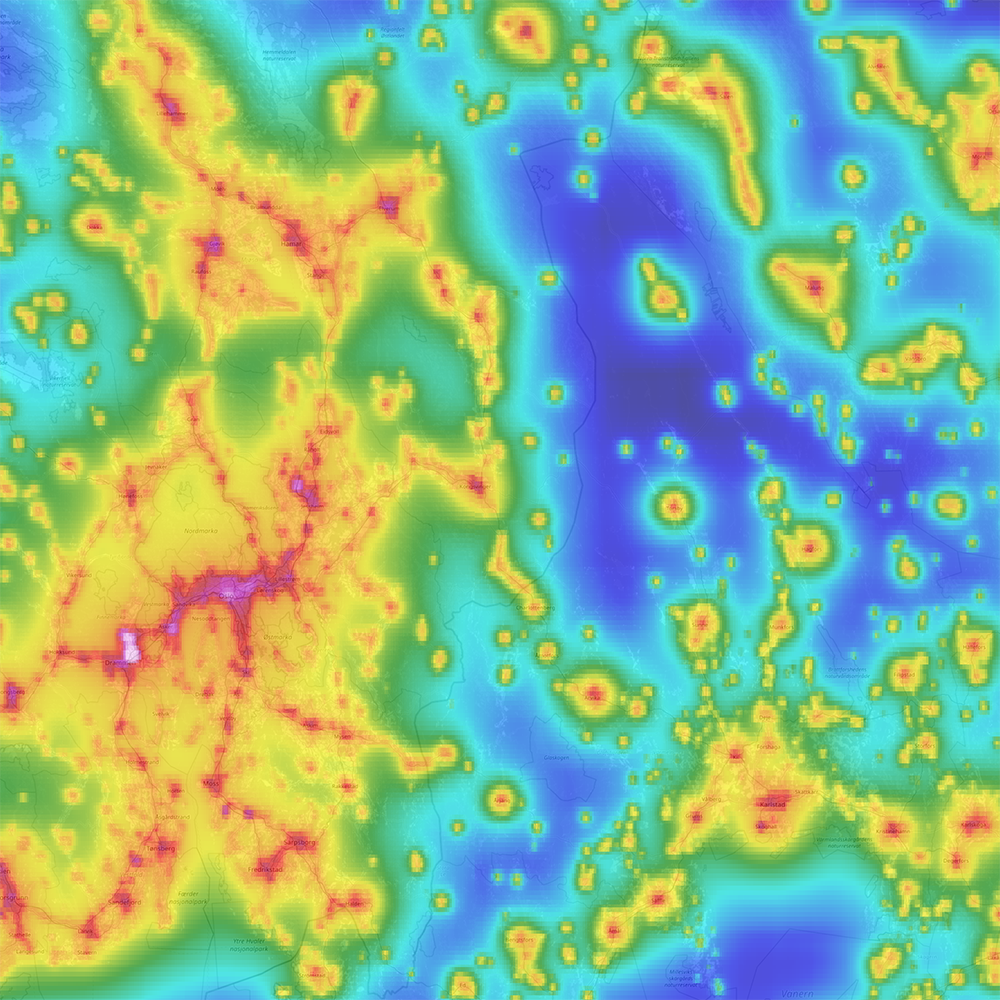
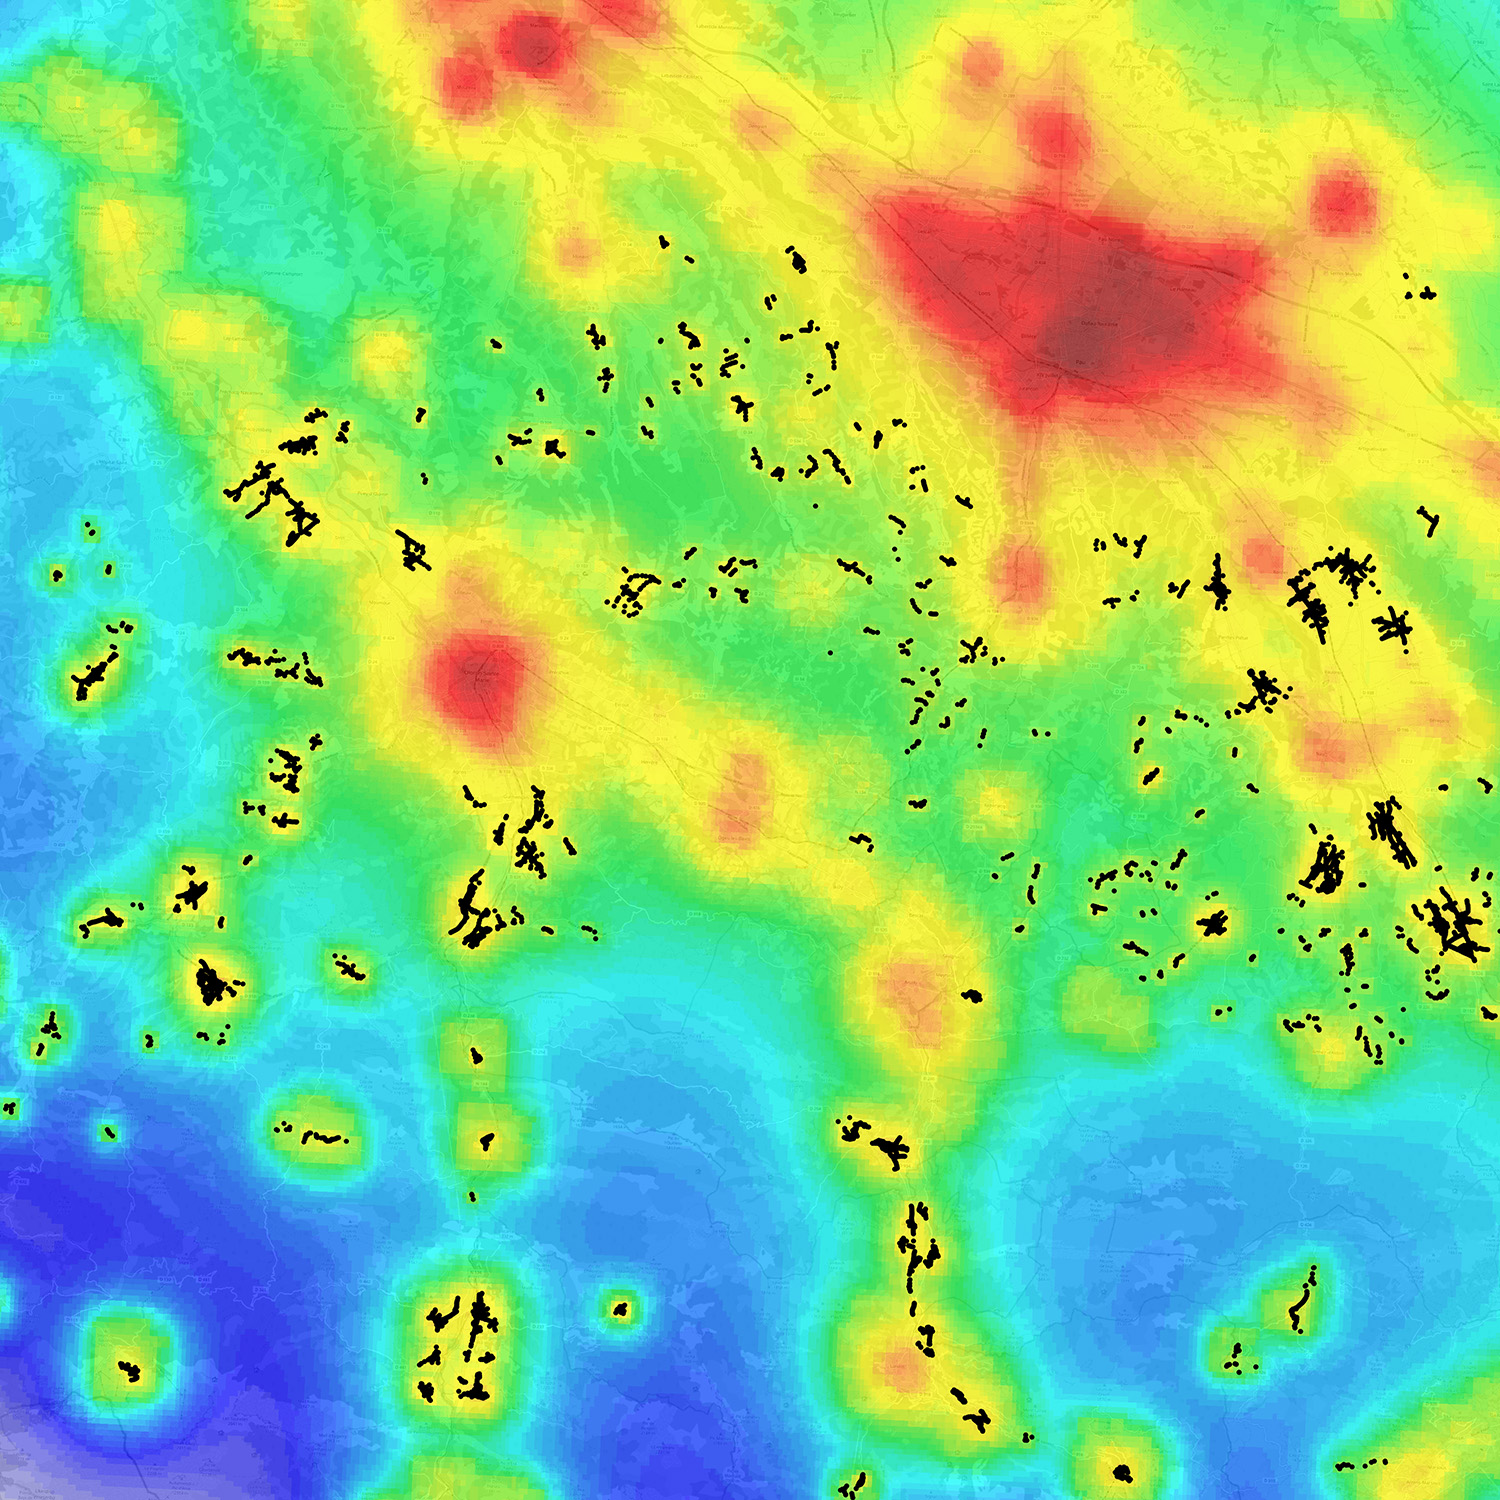
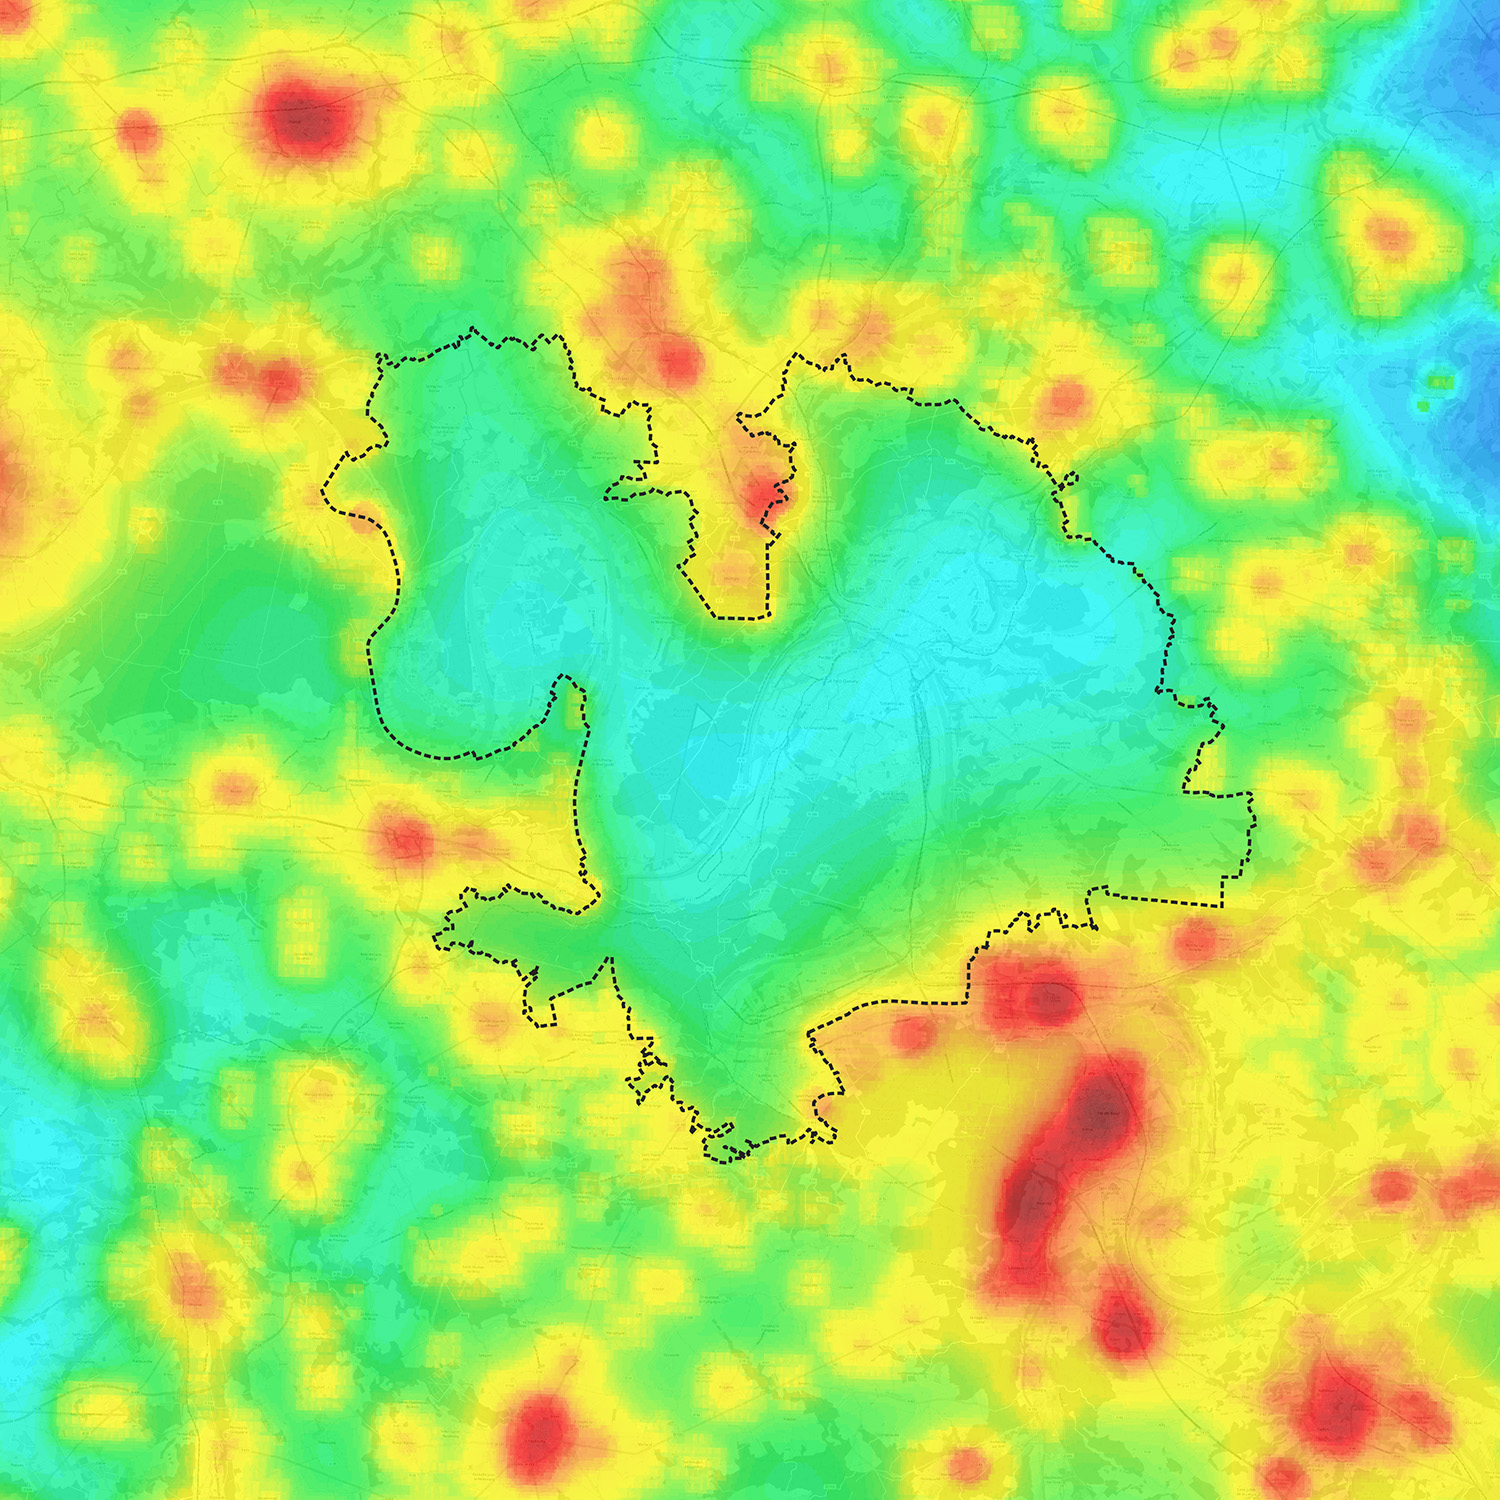
Artificial lighting makes the night sky "brighter", resulting in the formation of visible light halos over illuminated areas. This is known as "diffuse" light pollution. By mod-eling it, it is possible to map the level of sky brightness at all points in a territory, in various scenarios and situations.


Modeling sky brightness in the middle of the night
The periods during which certain lights are switched off (generally between late evening and early morning) are referred to as "middle of the night".
The modeling of diffuse light pollution in the middle of the night is based on satellite or aerial images acquired when these lights are switched off.
Low-resolution images from the VIIRS-DNB instrument are the main source of data used, as they are collected daily in the middle of the night.
Nevertheless, the use of high- or very-high-resolution images is recommended in certain cases, particularly in highly urbanized areas, in order to obtain more accu-rate light pollution maps.
What data do we work with?
What tools have we developed?


Modeling sky brightness at the beginning and end of the night
The end of the night (evening and early morning) is generally when lighting is at its brightest.
There are two ways of simulating diffuse light pollution during these periods:
from satellite or aerial images acquired at the end of the night;
from images acquired in the middle of the night, to which is "artificially" added the contribution of light points considered extinguished at the time of acquisition. This requires the identification of lighting shutdowns and the availability of data on extinguished light points. In the absence of data, we "virtually" recreate light points, using our Asio software.
What data do we work with?
What tools have we developed?


Simulation of diffuse light pollution scenarios
The Otus software options allow the set up of numerous scenarios, representative of real or fictitious situations, and compare the results:
Analysis of light pollution trends by season
Simulation of sky brightness with or without cloud cover
Impact assessment of projects to transform lighting installations (change lamp type, reduce power, etc.) or change lighting practices (introduce lighting shut-downs, etc.).
Evaluating the specific contribution of certain lighting sources or territories
What data do we work with?
What tools have we developed?

Our solutions in action
Would you like to see concrete examples of our applications?
We put our tools and methods to work on a large number of projects every year.


