Lighting greenhouses and light pollution
25 juillet 2020 - Philippe Deverchère

The picture above shows a greenhouse with private lighting.
Many districts are making efforts to switch off public lighting at the dead of night, in order to reduce light pollution and help preserve biodiversity. But these efforts are often thwarted by the increase in light pollution from private lighting. This is particularly the case in Finistère, where many greenhouses are used to grow winter tomatoes. This type of cultivation generally uses LED-based lighting with a strong blue component, designed to reproduce the solar spectrum at night and accelerate tomato growth. This results in very strong light emissions towards the sky, which are easily spotted on night-time satellite images.

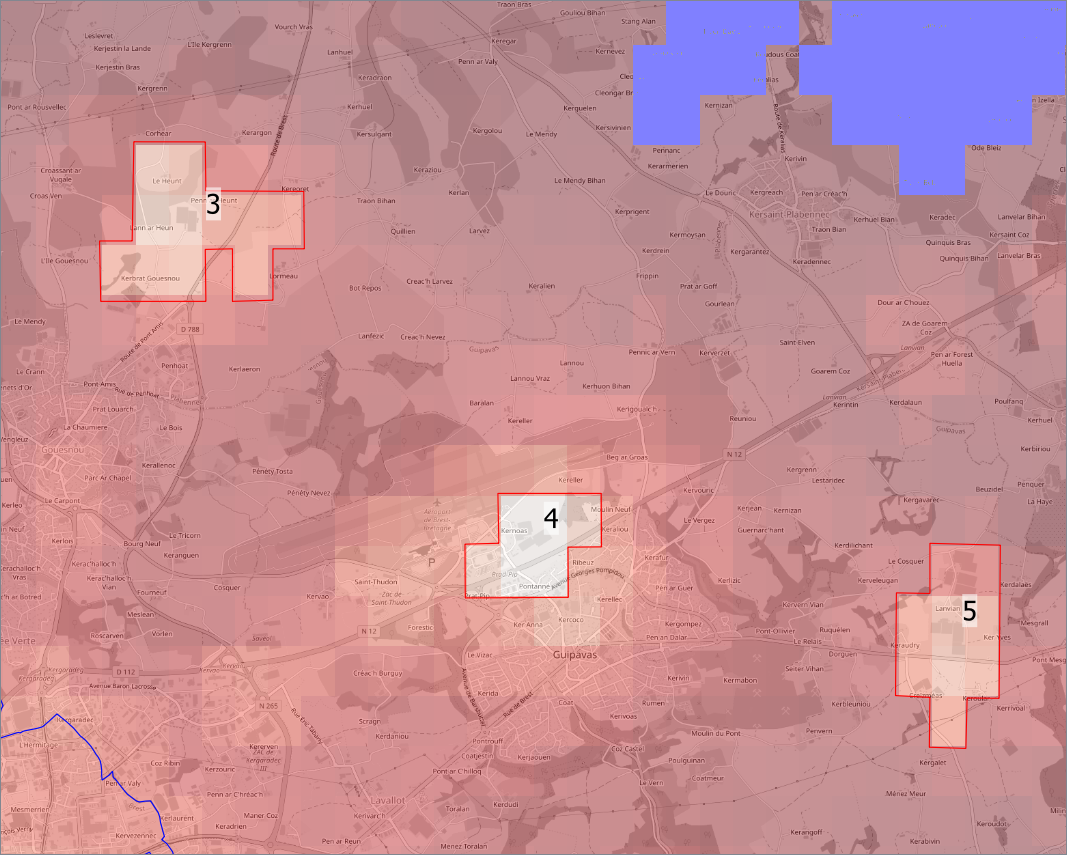
As an example, the map on the left shows 5 areas of very intense radiance associated with greenhouses (numbered 1 to 5). The radiance data shown on the figure are taken from the December 2018 VIIRS/DNB monthly composite set published by NOAA (see the VIIRS/DNB page on the NOAA website for more information). Thresholds have been adjusted on this map to highlight areas of high radiance.
Greenhouse lighting can typically last from October to April, as this type of production allows for more regular work spread throughout the year. An analysis of the monthly composites for the area since 2012 shows that some greenhouses are switched off during certain periods (probably linked to lighting ranges, crop type, disinfection periods and off-peak periods), but in general they are lit throughout the winter. Screening systems can be installed to prevent the emission of light into the nocturnal environment, but findings on satellite radiance images tend to show that they are used very little.
The thumbnails below show radiance data in the same area as in the figure opposite month by month between November 2019 and February 2020. On these thumbnails, the thresholds have not been specifically adjusted to highlight the areas of highest radiance.

4 of the 5 greenhouses are clearly visible throughout this period. One of the greenhouses (labelled N° 5 in the figure) is partially visible in November and December 2019.
It's interesting to compare the radiances emitted by the greenhouses with those emitted by nearby settlements. To do this, simply sum the radiance pixels associated with the greenhouses and do the same for the territory of a few settlements. However, as the radiances are extremely high on the greenhouses, significant scattering takes place on a scale of up to several kilometers. We arbitrarily decide to delimit the brightest pixels around the greenhouses, as shown in the radiance maps of the 5 greenhouses below (pixels in blue indicate a very low or even zero radiance value):


The unit of measurement for radiance emitted by light sources on the ground and captured from space by satellites is the watt per square meter per steradian (W-m-2-sr-1). Here we use a derived unit, the nW.cm-2.sr-1, which allows us to manipulate more readable values.
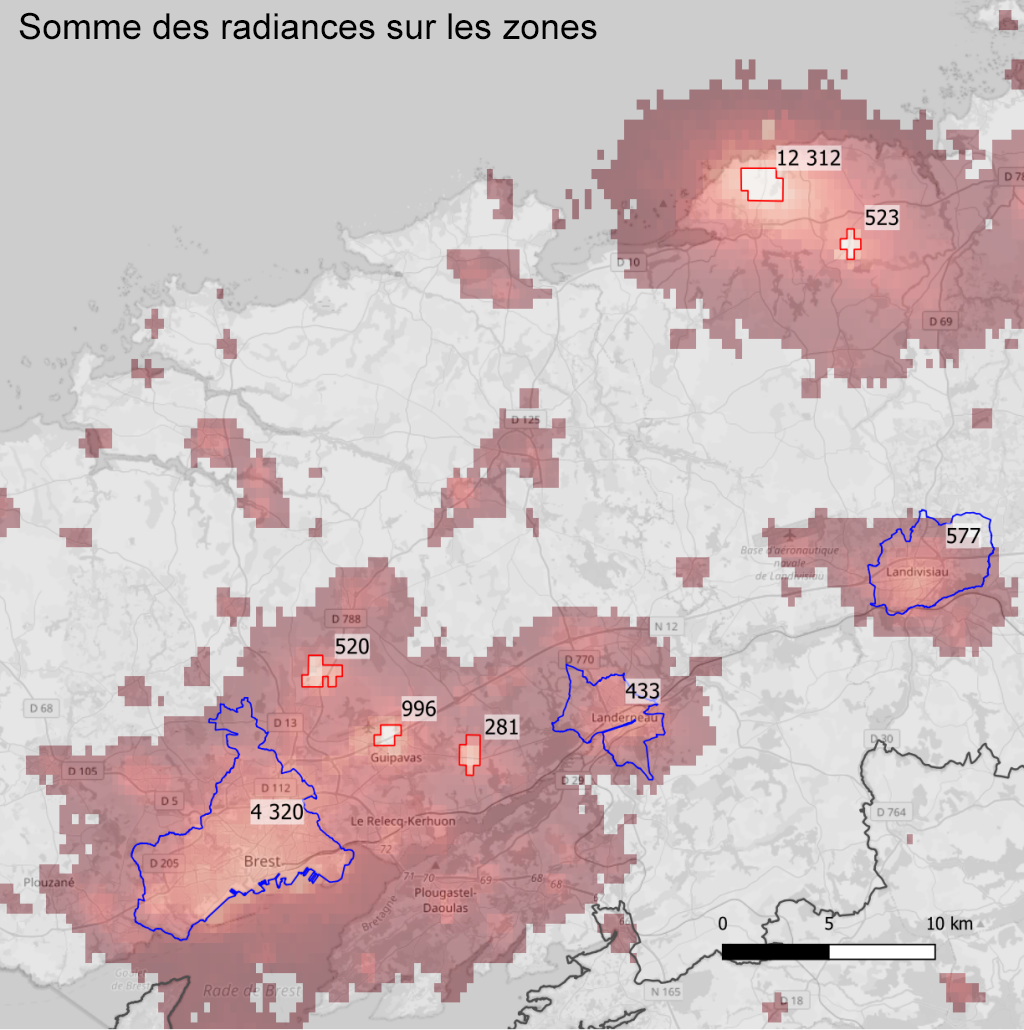
The map below left shows the pixel of maximum radiance for each of the greenhouse zones, as well as for 3 nearby agglomerations (over the entire territory of the communes) : Brest (140 000 inhabitants), Landerneau (15 746 inhabitants) and Landivisiau (12 200 inhabitants). The chart on the right shows the sum of all radiances for each zone. Radiances are expressed in nW.cm-2.sr-1.


It can be seen that the pixel of maximum radiance on greenhouse N°1 is almost 50 times brighter than the pixel of maximum radiance for the city of Brest. Similarly, the integrated radiance in the central part of the radiance zone of the same greenhouse is almost 3 times greater than that of the whole of Brest. This implies that greenhouse N°1 has about 3 times more deleterious effects than the city of Brest in terms of light pollution. It therefore produces as much skyward radiation, and therefore light pollution, as a city of 400,000 inhabitants. Similarly, greenhouse No. 4 has twice the impact of the town of Landerneau. Generally speaking, it's easy to see that industrial greenhouses are intense sources of light pollution.
The table below provides radiance pixel statistics for each of the zones.
| Area | Number of pixels | Sum of pixels | Average pixels | Pixels median | Minimum pixel | Maximum pixel | Value range |
| Greenhouse 1 | 16 | 12 312 | 769.5 | 792.5 | 137.2 | 1 855.1 | 1 717.9 |
| Greenhouse 2 | 5 | 522 | 104.5 | 105.0 | 84.0 | 126.8 | 42.8 |
| Greenhouse 3 | 11 | 519 | 47.2 | 47.4 | 17.3 | 84.5 | 67.2 |
| Greenhouse 4 | 6 | 996 | 166.0 | 184.0 | 83.1 | 242.0 | 159.0 |
| Greenhouse 5 | 9 | 280 | 31.2 | 22.6 | 7.4 | 63.6 | 56.2 |
| Brest | 346 | 4 320 | 12.4 | 12.2 | 0.6 | 38.6 | 38.0 |
| Landerneau | 96 | 433 | 4.5 | 3.9 | 0.8 | 16.0 | 15.2 |
| Landivisiau | 135 | 577 | 4.3 | 2.6 | 0.4 | 20.4 | 20.0 |

The halo associated with greenhouse N°1 is particularly significant, with an impact extending over several tens of kilometers.
It's important to note that the estimates of radiance, and therefore light pollution, provided in this post are very likely to be greatly underestimated for greenhouses using LED-based lighting systems. Indeed, the VIIRS instrument onboard NOAA's Suomi NPP satellite has a very limited spectral response in the blue part of the spectrum[1]. However, the LED-based lighting used in industrial greenhouses has a very high blue emission (blue light is also much better diffused in the atmosphere). It is therefore highly likely that the light pollution impact of night-time lighting in greenhouses without blackout systems is even greater than described here.
Industrial greenhouses that use night-time lighting without precautions make a major contribution to light pollution, as demonstrated in this short article. The deployment of such installations puts the efforts of Finistère's communes to switch off public lighting in the middle of the night (a widespread practice in Brittany) into perspective. The harmful effects of artificial light emissions on the nocturnal environment are well documented, and illuminated industrial greenhouses represent a worrying environmental problem for the future.
[1] Cao, Changyong & Bai, Yan. (2014). Quantitative Analysis of VIIRS DNB Nightlight Point Source for Light Power Estimation and Stability Monitoring, Remote Sens. 2014, 6(12), 11915-11935; doi:10.3390/rs61211915. Remote Sensing. 6(12). 10.3390/rs61211915.
