A perfect night in the Cévennes
February 13, 2020 - Philippe Deverchère
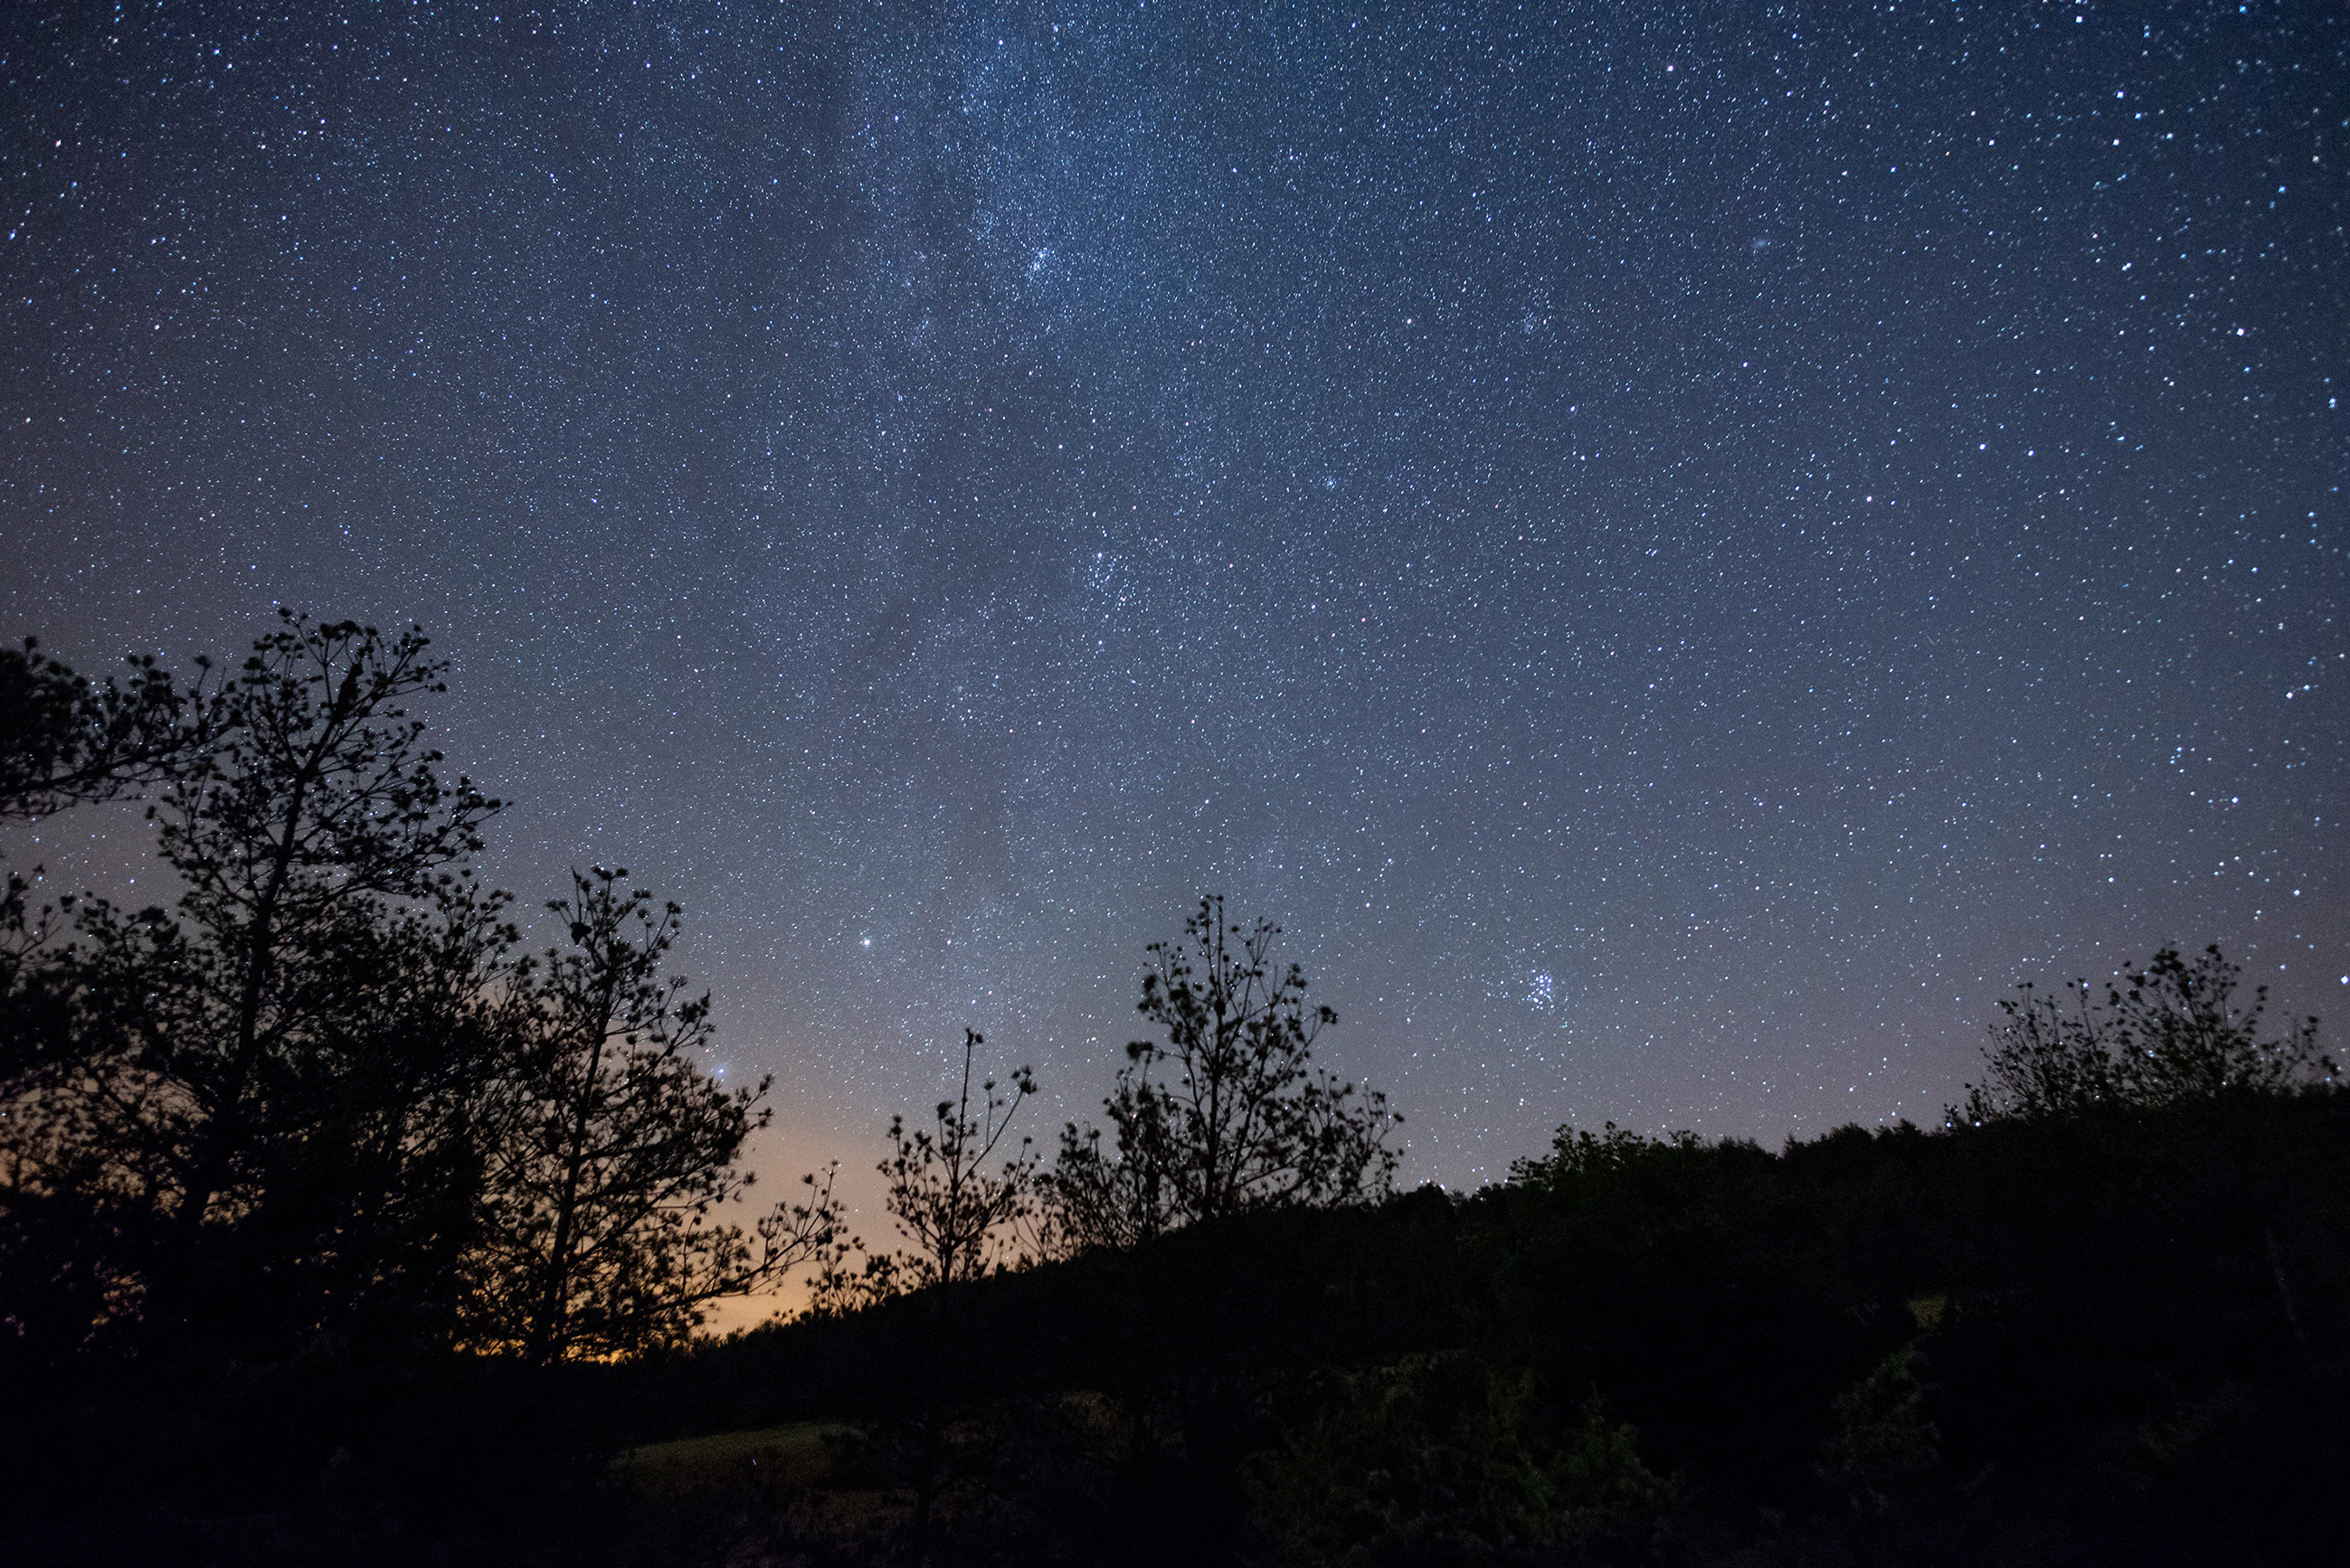
The image above, taken in 2018 in the Cévennes (but not on the night covered by this article), shows that the Milky Way (center) is brighter than the background sky.
The night of August 2 to 3, 2019 was a night like few others, in the heart of the Cévennes National Park. At a place called L'Aire-de-Côte in the commune of Bassurels, to the east of Mont Aigoual and in the southern part of the Parc National's core zone, a Ninox system recorded the luminance of the background sky at zenith, which can be described as "perfect" that night. The Moon, with a phase of 5%, was absent for most of the night, there were no cloud passages and, above all, sky quality was excellent, with very stable atmosphere, low humidity and low aerosol load.
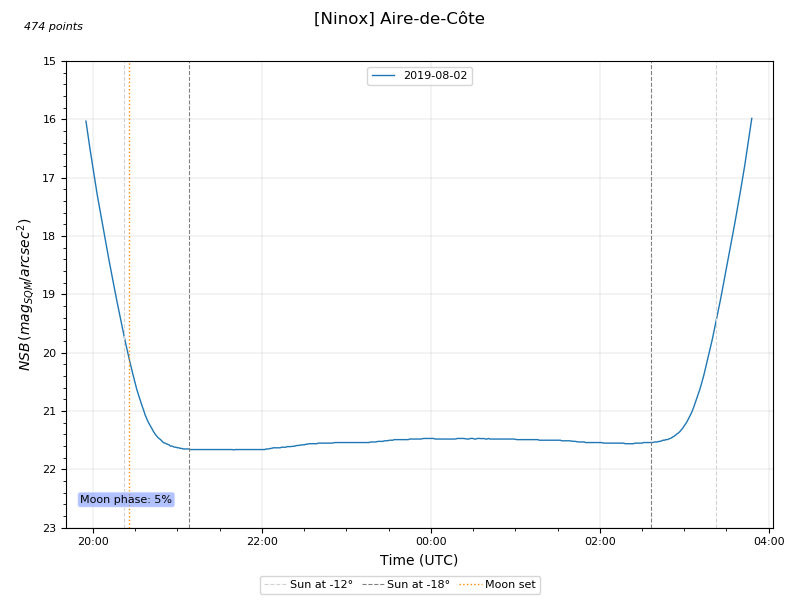
The figure on the side shows the results of luminance measurements taken on the night of August 2 (one measurement of the luminance of the background sky at zenith every minute). The time on the horizontal axis is expressed in Universal Time, and the luminance of the background sky at zenith on the vertical axis is expressed in mag/arcsec2 (this luminance is called NSB for Night Sky Brightness).
The diagram shows the Moon setting a little before 20:30 UTC (dotted orange vertical line) and luminance decreasing steadily as the Sun sets until reaching a stable level at astronomical twilight when the Sun is -18° below the horizon (dotted gray vertical line).
We can see that the NSB curve is quite smooth, indicating that the weather conditions were very good and without cloud passages.
If the night had been uniformly dark and without any nearby sources of light pollution, we might have expected to obtain a quite flat curve at the middle of the night. However, during the night, the curve undulates slightly, rising progressively until around 22:30 UT (the sky at zenith becomes a little brighter), reaching a plateau around 23:00 UT, rising again until around 00:30 UT and then gradually decreasing at the end of the night (the sky becomes darker again).
What is the origin of these variations?
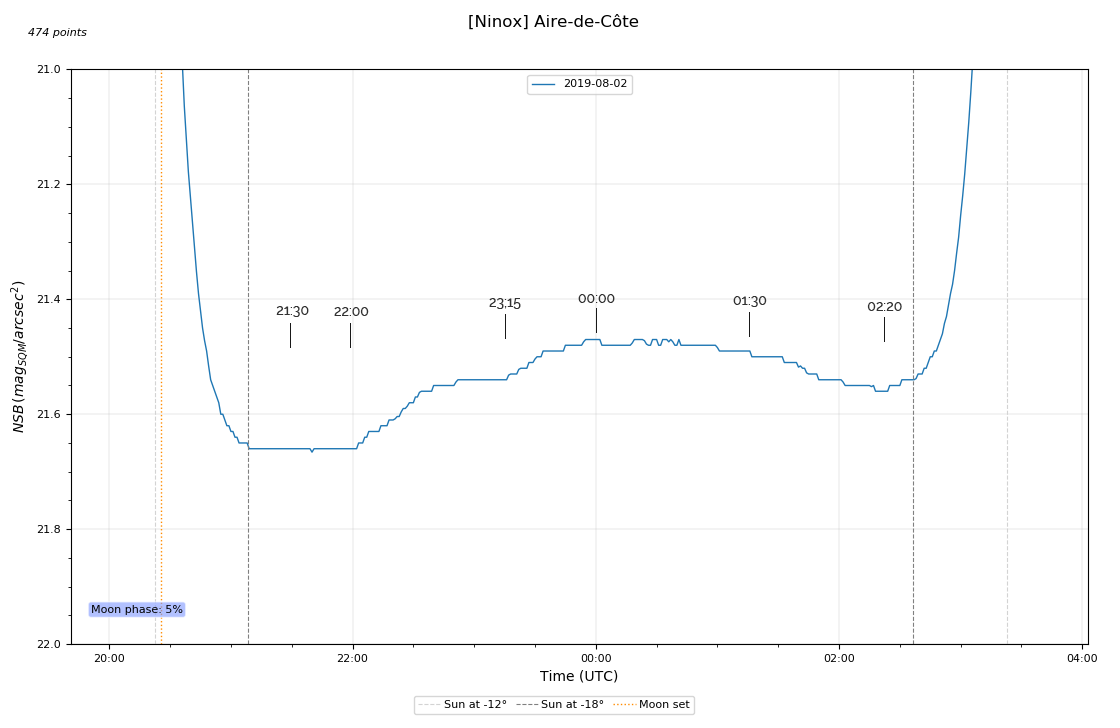
It turns out that they're due to... the Milky Way! At this time of year, the Cygnus region of the Milky Way passes through the zenith in the middle of the night. To visualize the Milky Way's contribution to background luminance, we'll plot its position relative to zenith at a few key moments on the curve. In the figure on the side (or above), we've stretched the NSB scale to show the variations in luminance (the small "stair steps" are due to the sensor's sampling capacity) and we've represented the times for which we'll be looking at the position of the Milky Way relative to the zenith.
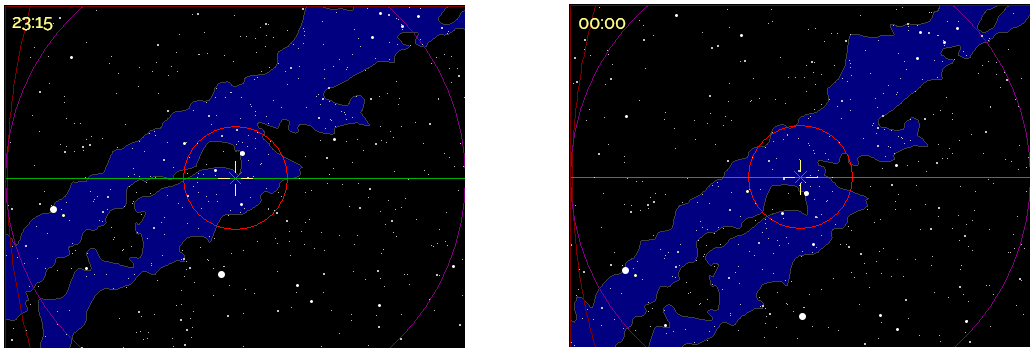
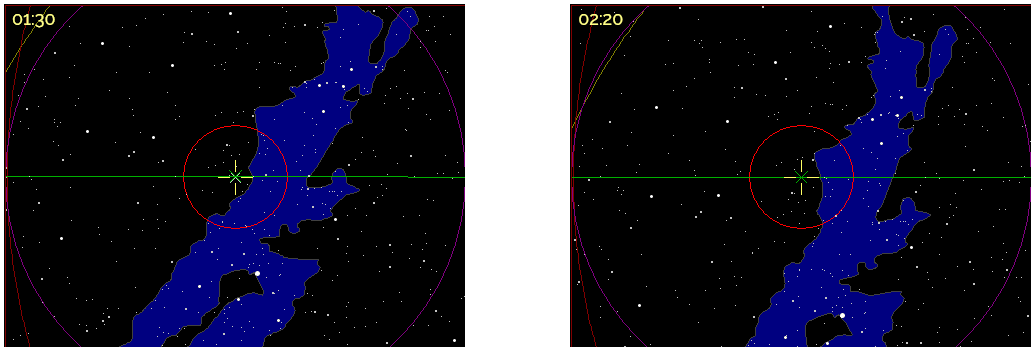
The figures below show the position of the Milky Way at different times. The zenith is represented by a yellow cross, the meridian is shown in green and the measurement field of the Ninox system (20°) is represented by the red circle. These maps were produced using C2A software. You can use your mouse wheel or keyboard arrows to navigate between images once you've selected the first one.
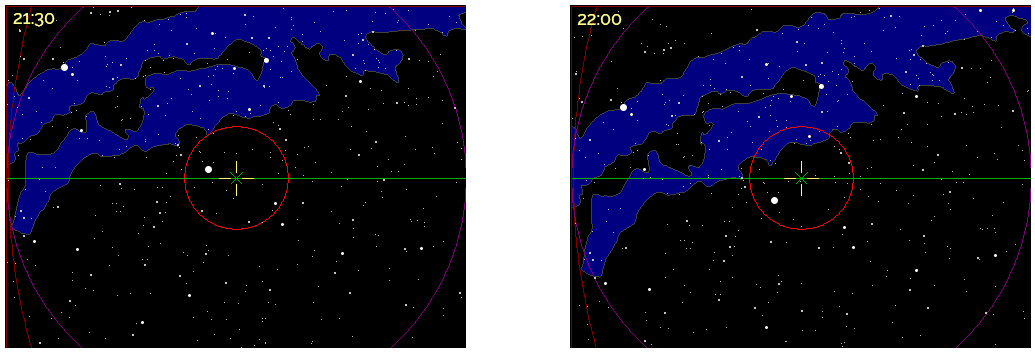
The variations in luminance on the NSB curve can be explained by noting that:
-
At 21:30 UT, the sky is at its darkest, as the Milky Way has not yet entered the Ninox field;
-
At 22:00 UT, the Milky Way begins to enter the field significantly, and luminance begins to rise;
Just before 23:15 UT, luminance growth has stabilized, as the dark zone of dust near the star Deneb (which is the bright star to the right of the dust zone) has now entered the field. This zone of interstellar dust, which cuts the Milky Way in two lengthways, is known as the "Great Rift";
-
At 00:00 UT, the brightest part of the Milky Way in the Swan region (just above Deneb, with in particular NGC 7000, the North American nebula) is right in the center of the field, and maximum luminance is reached;
-
At 01:30 UT, the Milky Way begins to leave the field, and luminance decreases;
-
At 02:20 UT, only a relatively faint part of the Milky Way remains in the field and, without reaching the level of the beginning of the night, luminance is now lower before rising again with sunrise.
The highest NSB level at the start of the night (darkest sky) is measured at 21.66 mag/arcsec2 and the highest level at 00:00 UT is measured at 21.47 mag/arcsec2. This represents a difference of 0.19 mag/arcsec2, which is quite significant for dark sky conditions. We can therefore see that, for quality sites with little impact from light pollution, it is important to take into account the position of the Milky Way to properly characterize sky quality.
