Sky brightness in Chile's Rio Hurtado valley
March 22, 2021 - Philippe Deverchère
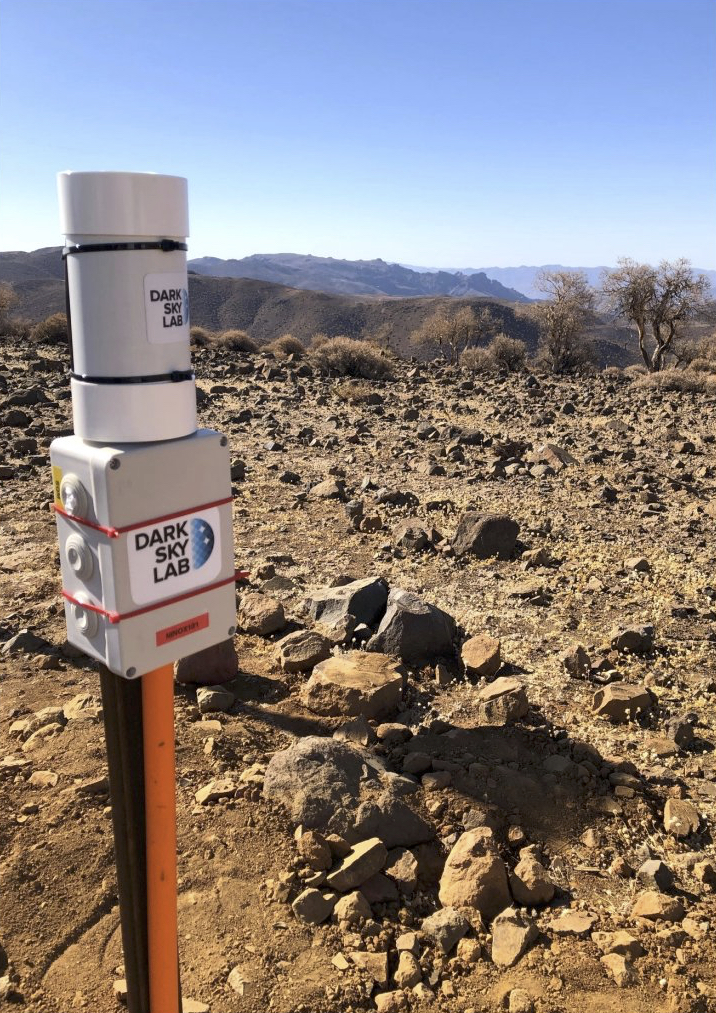
Deep Sky Chile operates a telescope hosting site in Chile's Rio Hurtado valley (see DeepSkyChile). A Ninox sky luminance measurement system (we wouldn't dare talk about measuring "light pollution" on such a site...) was installed there in November 2020 and has been accumulating measurements without interruption since then.
The aim of this blog is to present the first results obtained during these few months in a didactic way.
Before analyzing the results of the measurements carried out at the Deep Sky Chile site in the Rio Hurtad valley, it is important to understand that this is an exceptional site for several reasons:
-
First of all, there are hardly any clouds! This is, of course, highly unusual for people like us, who study light pollution mainly in mainland France. From this point of view, this site is a very special case where everything is simplified from the point of view of studying sky luminosity. Indeed, the presence of clouds makes the background sky brightness extremely erratic, with significant variations over durations of less than a minute (whether in darkening conditions when the site is little or not polluted by anthropogenic light, or in conditions of increased sky brightness if there are light sources at short and medium distances).
-
Secondly, the area in which the site is located has very little pollution from nearby light sources. Here too, the study of sky brightness is greatly simplified, since the variations observed are due almost exclusively to natural causes (Moon, Milky Way, star fields, zodiacal light, airglow, etc.).
-
Finally, sky quality is exceptional at this site, with an average seeing value of less than one arcsecond (i.e. atmospheric turbulence is very low). This contributes to very stable measurements of background sky brightness.
The Deep Sky Chile site is a laboratory for studying the natural causes of sky brightness!
Moonless nights
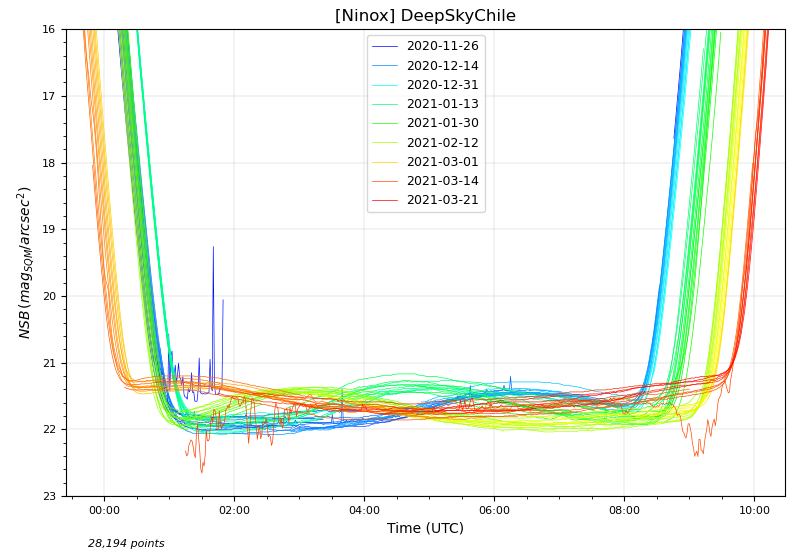
The first thing anyone interested in the study of light pollution does when arriving at a site is to assess the brightness of the background sky on clear, moonless nights. The figure opposite shows all luminance measurements taken when the Moon was more than 10° below the horizon between November 26, 2020 and March 22, 2021 (a measurement of the luminance of the background sky at zenith at a solid angle of 20° is taken every minute as soon as the Sun is more than 8° below the horizon). The time on the horizontal axis is expressed in Universal Time, and the luminance of the background sky at zenith on the vertical axis is expressed in mag/arcsec2 (this luminance is called NSB for Night Sky Brightness).
On the left-hand side of the diagram, you can see the descent of sky brightness at the start of the night, and on the right-hand side, the rise at the end of the night. The duration of the nights varies over time, and the empty intervals in the descent and ascent profiles represent nights when the Moon was present in the sky and for which measurements are not reported. The color scale used makes it easy to identify the period to which each curve relates, using the associated legend. The night of December 3, 2020 (in blue) shows peaks due to activity around the measuring instrument, and the nights of March 14 and 15 are the only ones to show a disturbed profile corresponding to the presence of clouds (at the end of the night for the 14th and at the beginning of the night for the 15th).
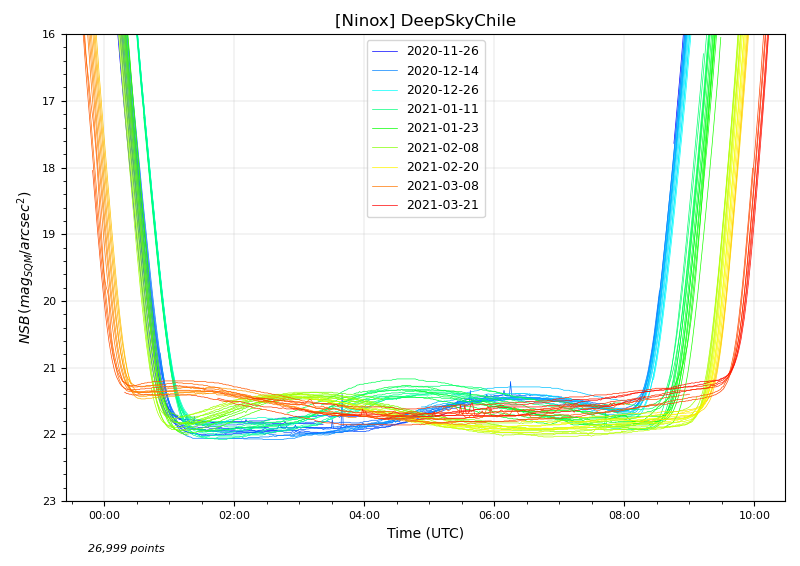
Apart from these 3 nights when the measured pofils are disturbed, all the other nights have very smooth profiles that are characteristic of very fine weather (the few remaining small peaks are linked to activities near Ninox). The same diagram is shown opposite, eliminating the 3 nights concerned.
What's spectacular about this set of curves is the oscillation of the profiles over the course of the night. The higher parts of the profiles (reflecting the brighter skies) correspond to times when the Milky Way is at its zenith (i.e. within the field of view of the Ninox sensor). The lowest parts are those when the Milky Way is completely absent from the zenith.
As the lunar cycle progresses, the "wave" profile shifts to the left of the diagram. At this time of year, the constellations of the Great Dog, the Poupe and the Compass are at their zenith a little earlier each month, between December and March. The amplitude of the Milky Way's contribution is estimated at 0.6 mag/arcsec2, which is considerable and significantly higher than that observed in the Northern Hemisphere. An even greater amplitude is expected during the austral winter, when Sagittarius and Scorpio will pass through the zenith near the Galactic center.
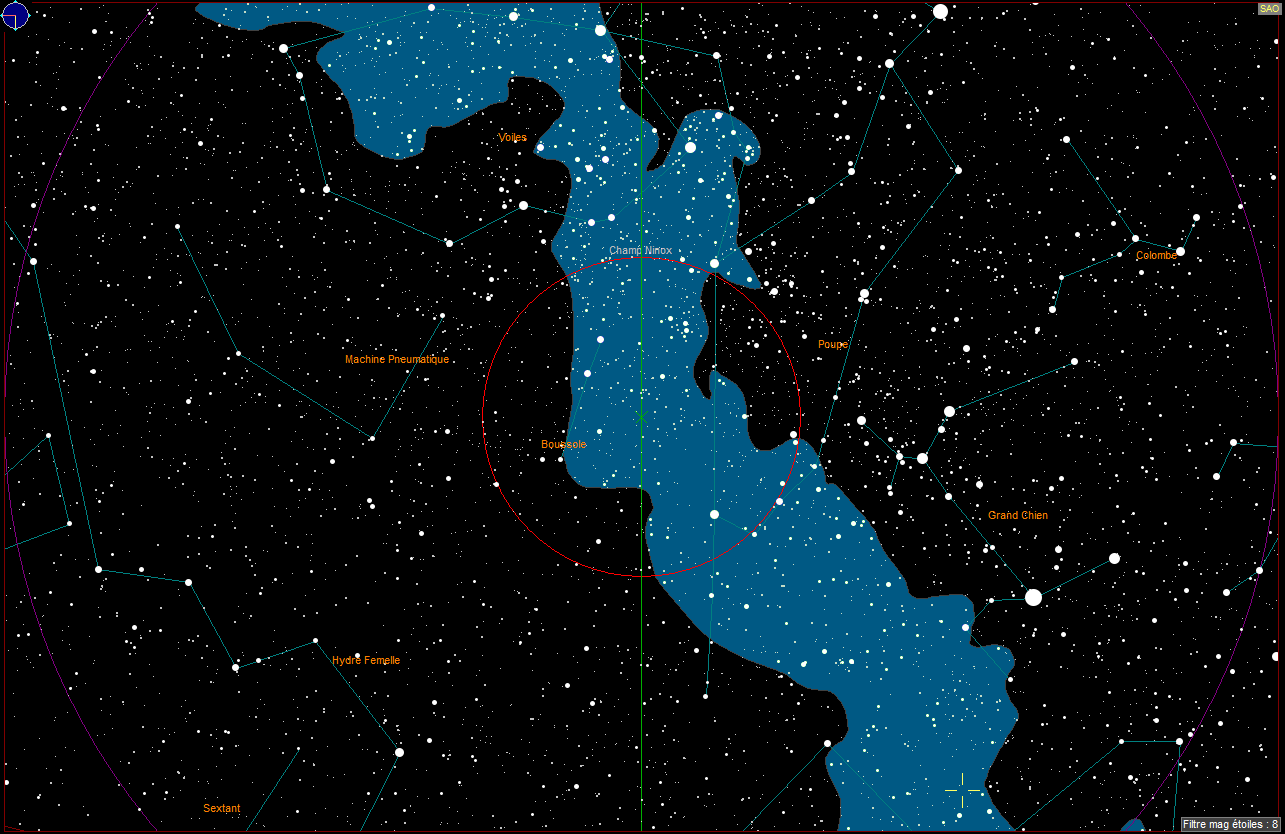
The map opposite (produced with C2A software) shows the sky configuration on January 23, 2021 at 05:00 UT. On the recorded curves, this date and time correspond to one of the moments when the sky was at its brightest.
On this map, the zenith is in the center (small green cross) and North is at the bottom. We can clearly see that the Milky Way is perfectly at zenith, with the constellations of La Poupe and La Boussole in the Ninox system's luminance measurement field (red circle).
The best NSBs when the Milky Way is not at zenith are in excess of 22 mag/arcsec2, testifying to a very dark sky perfectly free from light pollution at zenith. An important point to note is that not all nights are the same over a period of a few days. There's a spread of curves that denote varying conditions from night to night, which is of course to be expected, but which is spectacularly apparent on this virtually cloudless site. So even on this exceptional site, you need to choose your nights to achieve the perfect pose on a deep-sky object!
Nights with cloud passages
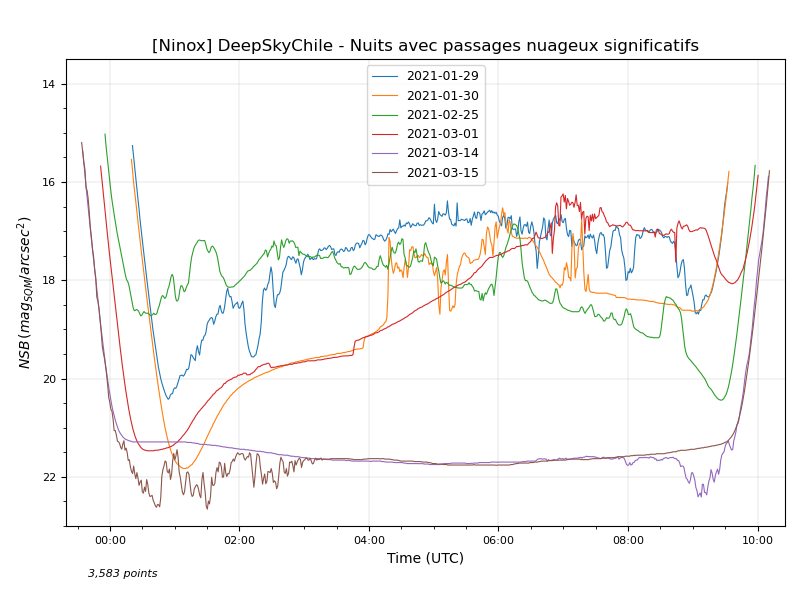
Over the entire period between November 27, 2020 and March 22, 2021, only 6 nights saw significant cloud passages (2 in the absence of the Moon and 4 in the presence of the Moon).
The diagram opposite shows the NSB curves associated with these 6 nights. We can see that when the Moon is absent, the sky is systematically darkened by the presence of clouds. For nights when the Moon is present, the levels are high and disturbed, as you'd expect.
We can see that the disturbed profiles can take different forms, depending on the type of cloud cover (small, regular disturbances for uniform cloud cover, and sudden variations in the case of cloudy passages with gaps).
Visualizing the passage of the Milky Way
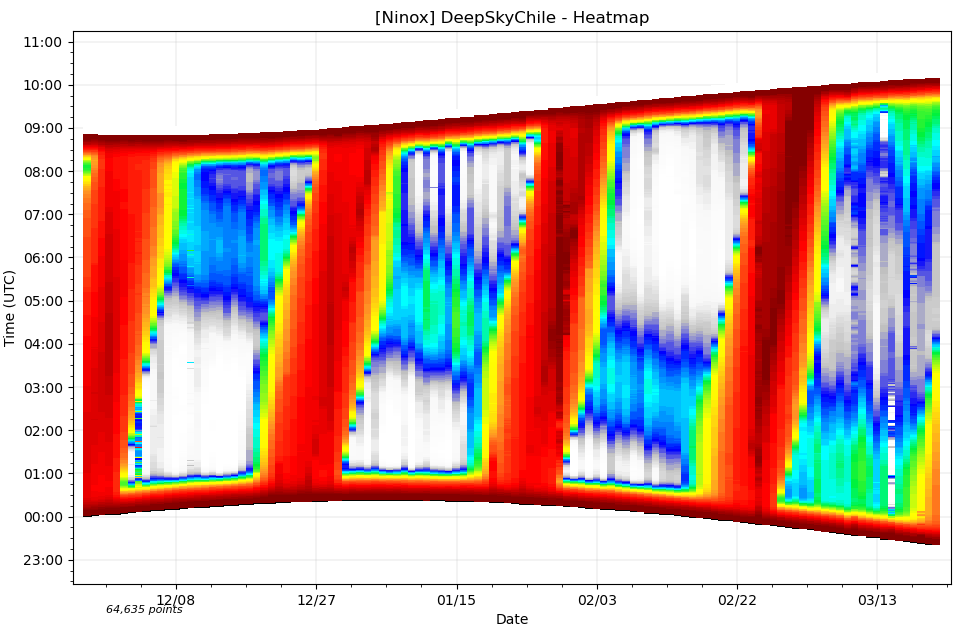

This diagram is rich in information. It shows the variation in the length of nights over the weeks (nights are getting longer as we enter southern autumn). We can also see the effect of the obliquity of the ecliptic and the ellipticity of the Earth's orbit around the southern summer solstice, with nights at the end of December and beginning of January starting to lengthen in the morning, while the Sun continues to set later (i.e. the sunset time at the bottom of the diagram continues to be later, while the sunrise time at the top of the diagram also becomes later). It's not until the second half of January that night lengthens both in the evening and in the morning.
The very red areas that recur each month correspond to the dates of the Moon's presence. The Milky Way's passage through the zenith is perfectly visible with the blue/green zone (i.e. higher luminances) shifting day by day as it rises earlier. This is the area of the constellations of the Great Dog, the Poupe and the Compass in the Milky Way. A new area of the Milky Way begins to appear at the end of the night in March, on the right-hand side of the diagram. This is the constellation Scorpio, soon to be followed by Sagittarius. From mid-March onwards, the galactic latitude of the zenith never exceeds 30°, and we can see that the brightness of the sky no longer descends to the very dark levels we used to have at the end of the night at the beginning of the month.
The influence of the Moon
When studying light pollution, we usually carefully ignore nights when the Moon is present, due to its very high contribution to sky brightness. However, in the case of the Deep Sky Chile site, the absence of clouds means that patterns in the Moon's contribution to sky brightness are clearly visible. The 3 diagrams below show the measurements obtained during the 3 lunar cycles since December (December 14, 2020 to January 13, 2021, January 13, 2021 to February 11, 2021 and February 11, 2021 to March 13, 2021). Only measurements where the Moon is present in the sky have been retained.
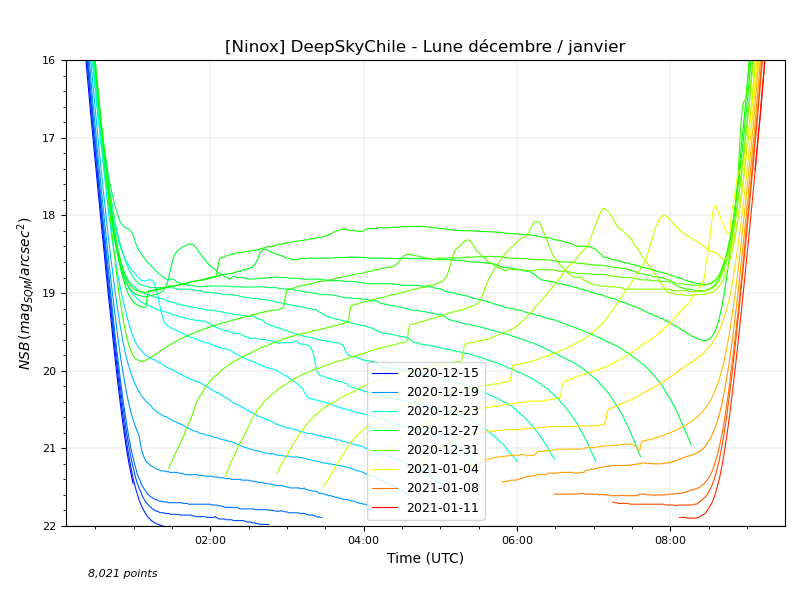
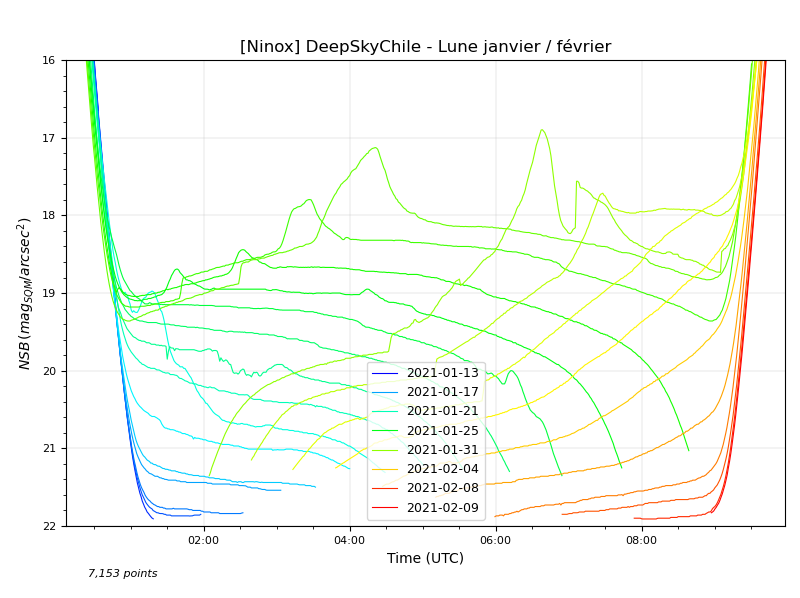
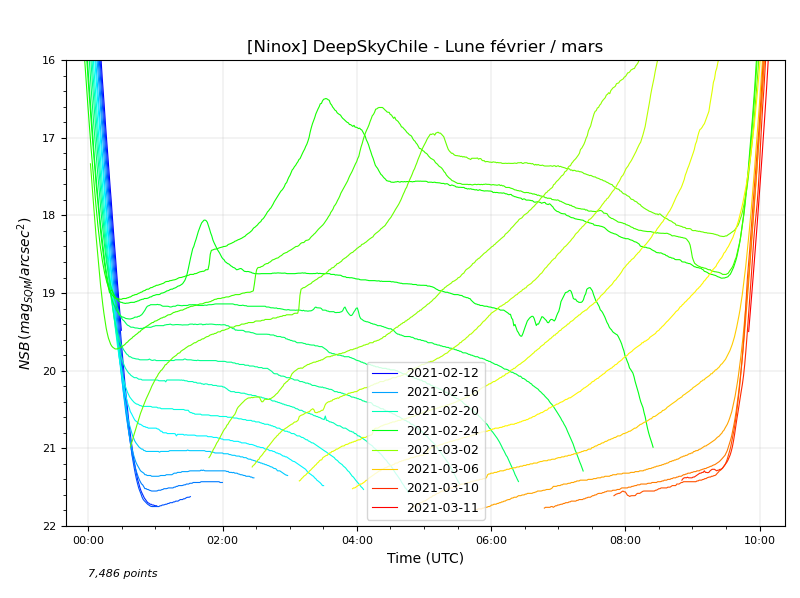
It can be seen that the highest levels at the time of the full Moon are higher and higher in the diagrams over the 3 lunar cycles. This is due to the fact that the Moon's height in the sky is higher month after month as it passes over the northern meridian. There's also a "stair-step" effect on the rising and falling profiles. These occur when the Moon is high enough in the sky to illuminate the inside of the tube housing the sensor. The "dromedary bumps" on the highest Moon profiles are due to the Moon shining directly on the photometer inside the tube.
Conclusion
In conclusion, we can only be impressed by the high quality of the nights at this site in the Chilean mountains! It shows beyond doubt that the Milky Way's contribution cannot be ignored when studying light pollution through photometric measurements. Over the coming months, we'll be refining our analyses of the Milky Way's contribution to sky luminance, and in particular studying surface brightness as a function of Galactic longitude. The data accumulated at the Rio Hurtado Valley site will also enable us to calibrate the corrections to be applied to the NSB measurements of any site to exclude the Milky Way, in order to isolate the contribution of artificial light (a future blog will detail this approach).
